In this article
The Profit & Loss statement forecast presents the profits, costs and result for a future period. It is an important tool for tracking the management of the company which allows you to understand how the situation will evolve, from an economic and financial point of view.
With Banana Accounting, thanks to the forecasts with the double entry method, you have complete forecast budgets that you can organize in different ways. The program also calculates forecasts over several years.
You can have a very precise vision of the evolution of the economical situation.
The structure of the Profit & Loss statement is the same as that used in accounting file. When printing, you can indicate which values to display, those of the final balance, or the budgeted balance or of both.
The forecast values are calculated taking into account the opening balances and forecast movements indicated in the Budget table. When you change a budget entry, the forecasts are instantly updated. You can simulate and test, relocate a payment, add an investment, modify sales and see how the profit and loss statement changes over time.
Profit and Loss statement values can be displayed in several ways.
Use of quantities and formulas
The quantity and price columns of the Budget table allow you to prepare more realistic forecasts, using the same methodology as spreadsheets. This allows for faster simulations. It is sufficient that you change the price and you access the new forecasts of the Profit & Loss statement automatically and also those of the Balance Sheet and Liquidity.
The formulas allow you to automate cost calculation, so that for example, when you change sales the purchase costs change in percentage. In this way you can use precise income statement forecasts that update automatically. Formulas are particularly useful when making forecasts over multiple years.
Detailed forecasts
The Income statement forecast, based on the double entry method, allows you to obtain the forecasts of the costs and revenues, using the same accounts and groups as those of the accounting file. The same structure of the items, that make up the income statements, is used for forecasting. Values and reports are available automatically to display in detail, day by day, how liquidity evolves and the situation of customers.
The structure of the Chart of Accounts, on which the forecast is also based, is customizable. This can be done by simply using the main groups and the accounts that are part of it, or more in a more complex way, by also inserting subgroups, for a more detailed view.
The structure of the Profit and Loss Account is gradually scaled and allows you to view the interim and final results for the year after paying the taxes.
PROFIT AND LOSS STATEMENT
- Revenues.
- Cost of goods.
Gross operating result (total of Revenues and Costs).
- Staff costs
- General costs.
Operating result (total of the gross operating result, personnel costs and general costs).
- Financial costs.
Operating result before taxes and depreciation(Total of operating result and financial costs).
- Depreciation.
Operating result before taxes (Total of ordinary Result and Depreciation).
- Taxes
Net operating result (total of the Result before taxes and Taxes and duties).
Accounts / Category Table
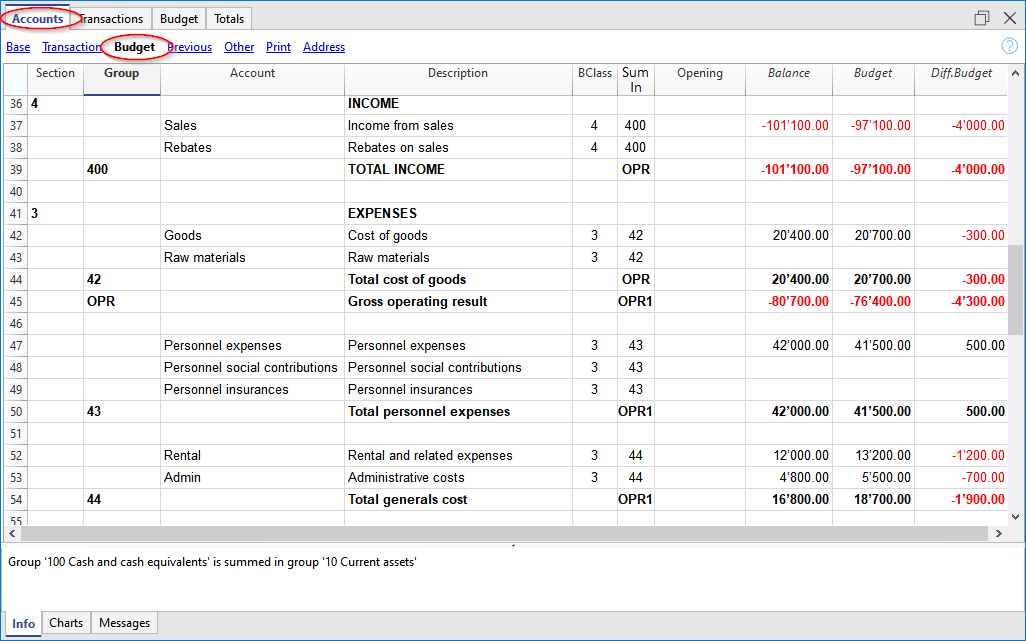
In the Accounts table, for Double entry accounting, and in the Categories table for Income and Expense accounting, the forecast values for all the accounts (or categories) and groups of the Profit and Loss statement are displayed. With a glance you have an instant view of the forecasted Profit and Loss statement. The values refer to the accounting period and the variations are compared to the current balance.
If you require more details, you can add accounts or groups.
Profit and loss with groups
Through Enhanced Balance Sheet with groups command, you can view the Provisional Profit and Loss Statement, choosing the presentation mode you need.
- Indicate in the Sections options to display the values of the Budget
You can display the current (accounting) values, the budget values or both. - Set up the Period.
If a period that exceeds the accounting period, is indicated, the program will automatically switch to budgeting over several years. - Indicate the subdivision by period required.
- In the Rows section, you can exclude accounts and thus have a view of groups only.
- If you think you're use this print setting again, create a Customization.
Using the different options you can customize your prints. Below are some examples.
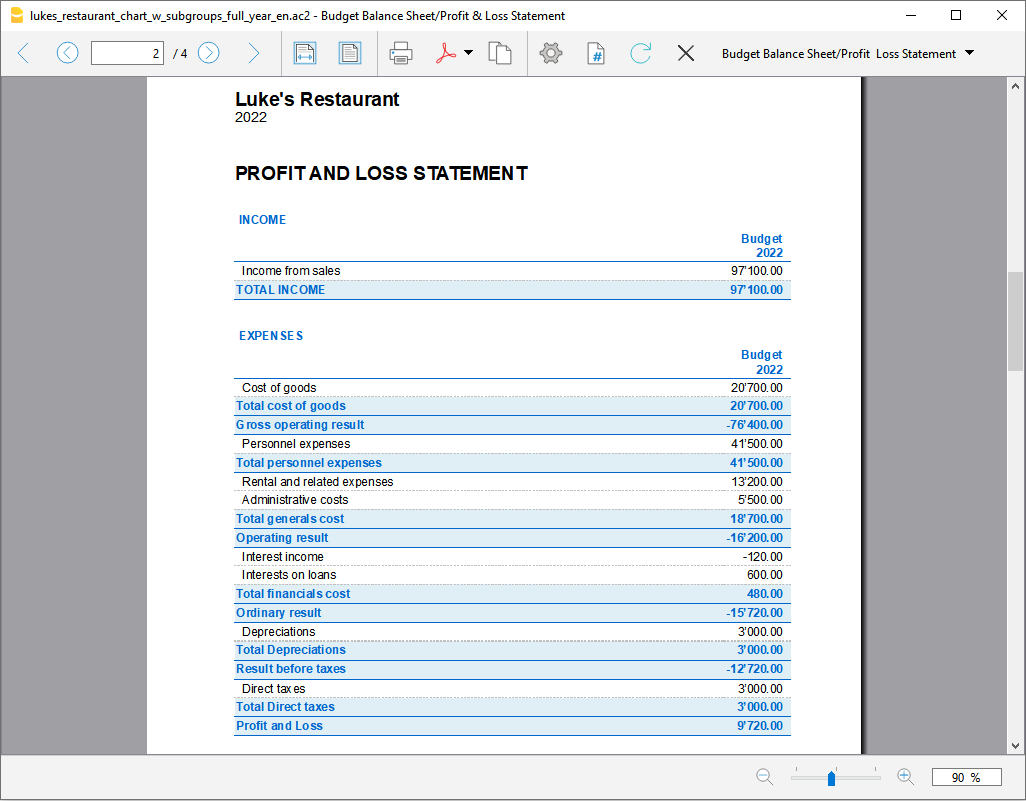
Annual Budget Profit and loss
This print was set up with only the budget values for the current year.
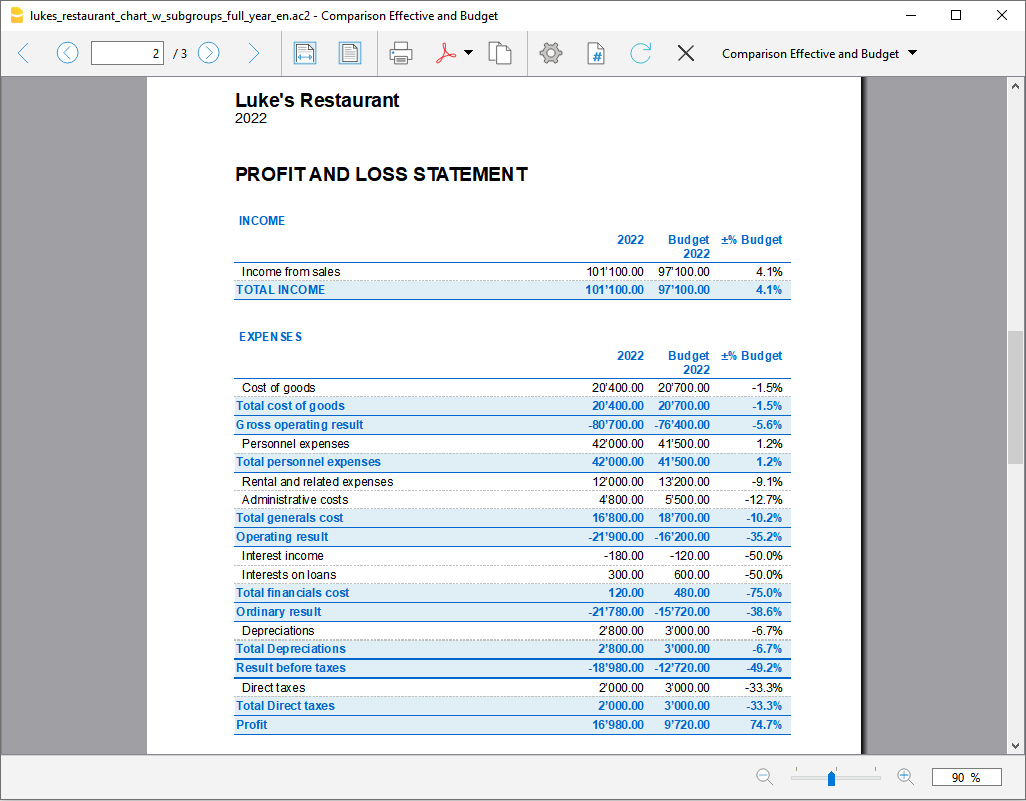
You can also display the change as an amount and a percentage.
Budget Profit and loss statement and current year comparison
The final (current) values are compared with those of the forecast.
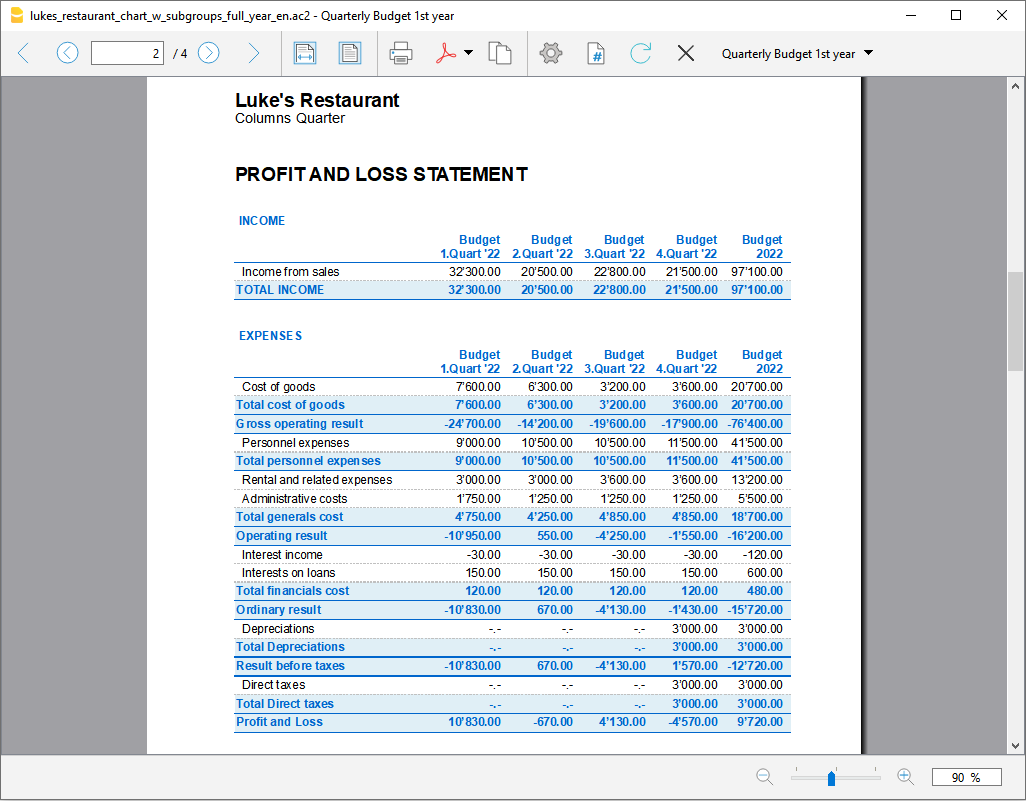
Quarterly forecast Profit and loss statement
In the Subdivision section set quarterly and the program shows the forecast Profit and Loss statement for the various quarters.
The evolution of the budget forecast during the year will now be displayed.
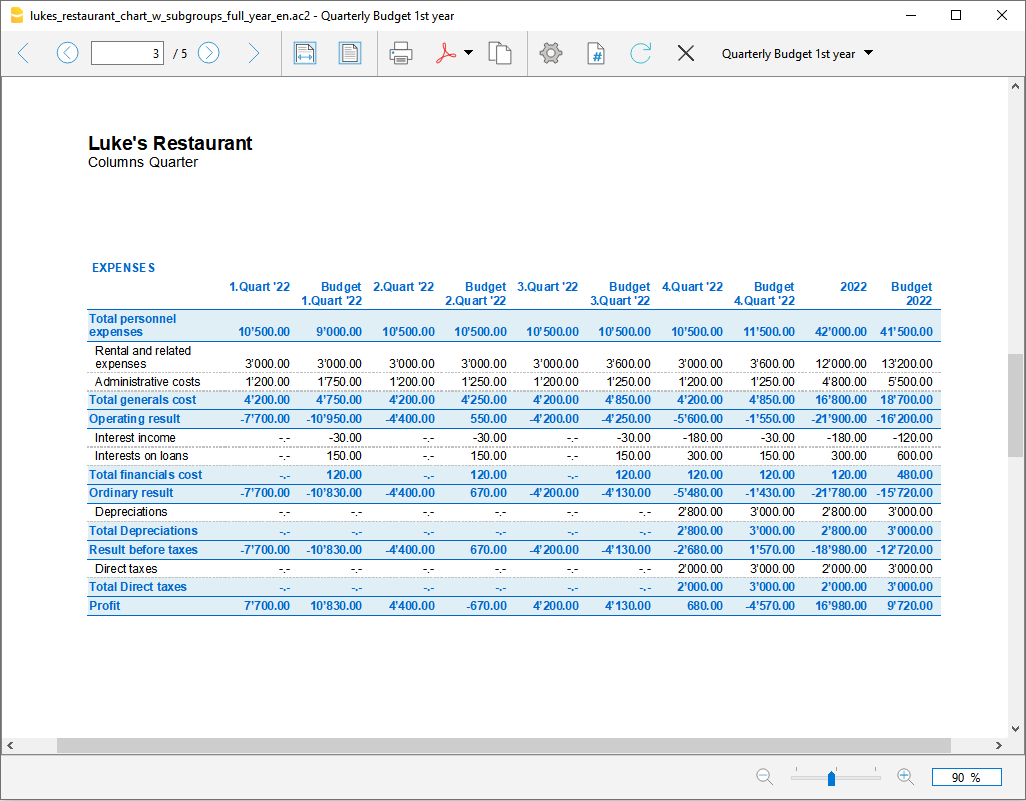
Budget and quarterly Profit and loss statement
This print is set up to print the budget and the final balance. Thus we have the budget and current situation for the quarters.
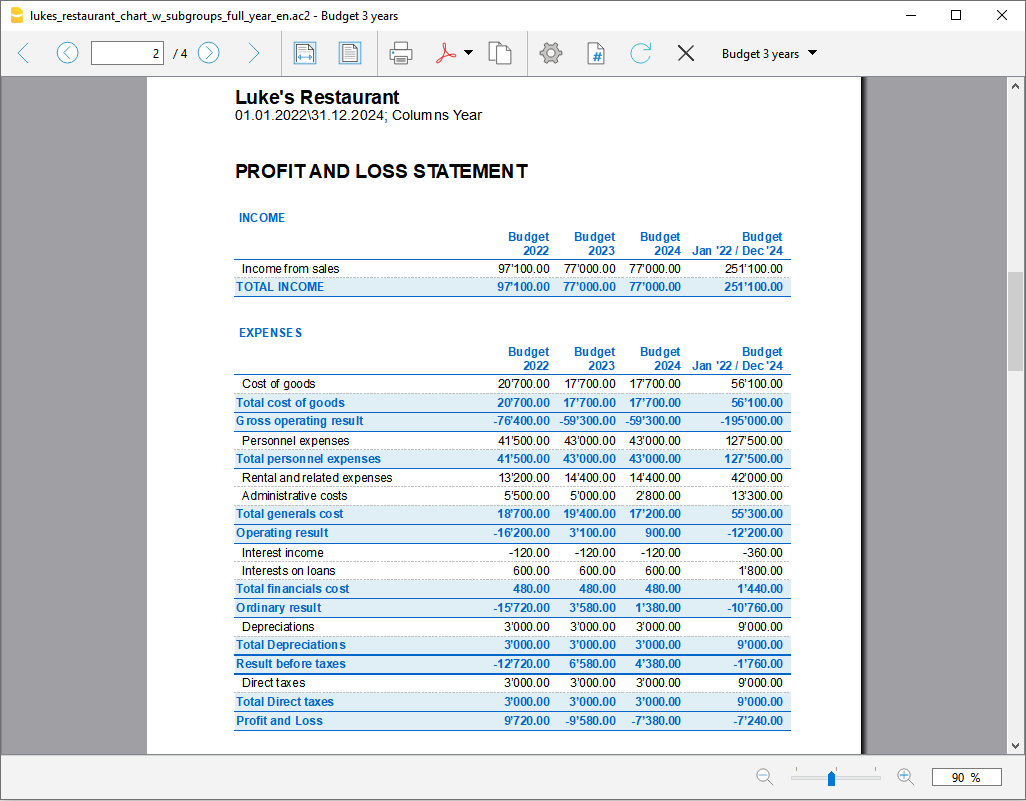
Three-year forecast for Profit and Loss account
If you insert the forecast movements with the repetition code, the program is able to prepare forecasts beyond the defined period.
To obtain forecasts over several years, the transactions are entered in the Budget table with repetition (Y).
The printout is set up to obtain the estimate of the Profit and Loss statement over three years.
Accounting Report for Budget Profit and Loss
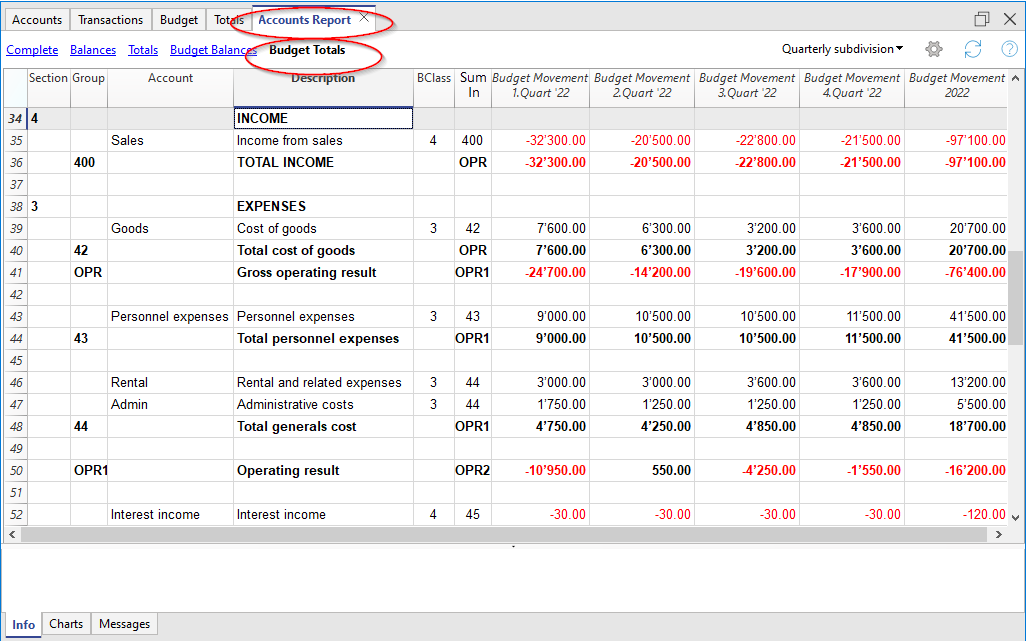
From the Reports → Accounting Report menu you can get printouts of the Profit and Loss Statement displayed as in the accounts table, but with the required column values.
The options are similar to those explained for the Enhanced Balance Sheet by groups.
