In this article
Cash is King is the motto that indicates how important liquidity is. It is the main engine for carrying out business activities, meeting commitments and producing profits. To invest safely, it is essential to evaluate the ability to produce liquidity and its evolution over time a rational way.
The financial forecast of Banana Accounting is an important business management tool, which allows you to understand if there will be enough financial means to meet commitments and reduce your debt exposure to the maximum.
Liquidity projections are calculated on the basis of the initial balance and forecasts included in the Budget table. When a budget movement is changed, the forecasts are instantly updated. You can run different simulations, assign a payment, add an investment, modify sales and see how liquidity evolves.
Liquidity values can be displayed in several ways.
Accounts table
Set up accounts and liquidity groups in the Accounts table. In the Budget column you will also see the updated forecast balances for the accounting period. At a glance you will know what the liquidity situation will be at the end of the year.
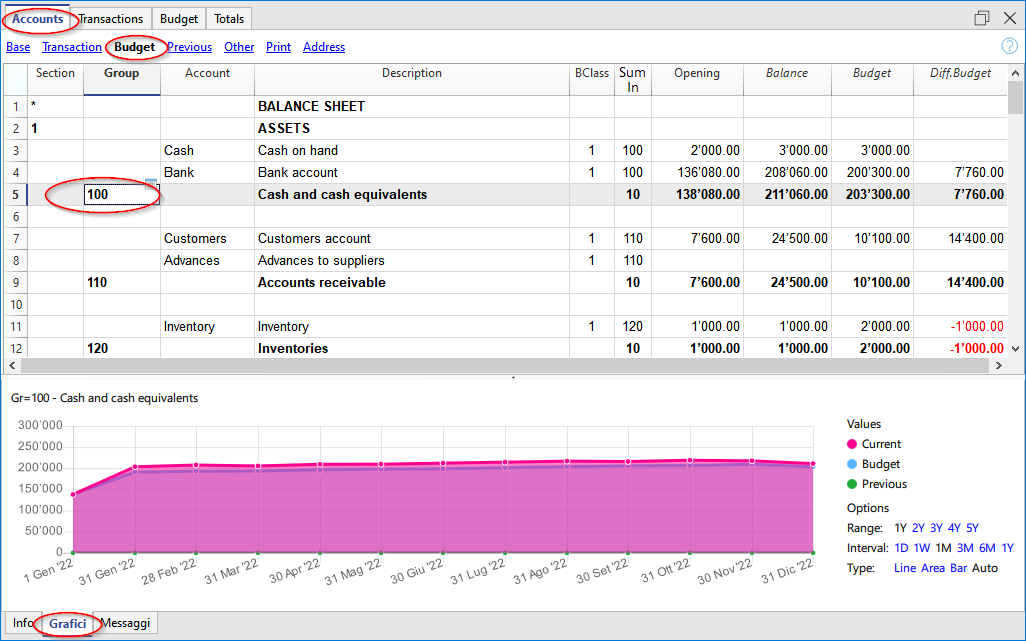
Evolution graphs
When you open the Charts window, positioning the cursor on an account or a group you will see the graph representing the evolution of Liquidity.
In the legend are visible Current, Previous and Budget. By clicking on each one it is possible to hide or make visible the respective graphs.
Account card with Budget Group liquidity
Using the Budget Account card command, all forecast movements of the account card are displayed. Day by day you can see which movements will have an impact on the liquidity.
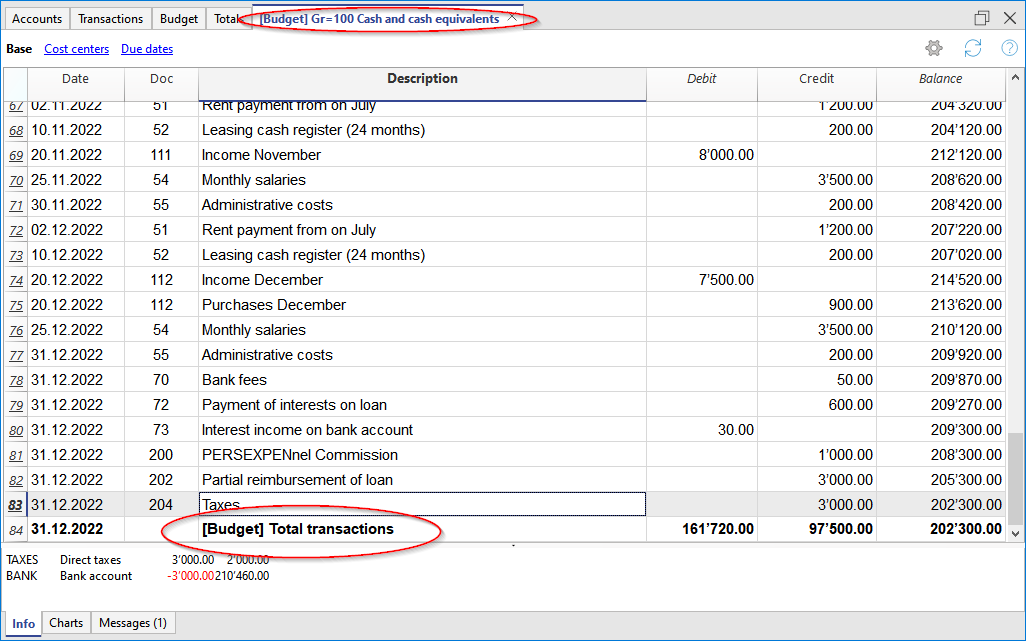
The Account card command allows you to specify if you want to see current or budgeted movements.
- Select budget movements.
- Set the period
If you indicate a period that exceed the accounting period, the program will automatically generate Forecasts over several years. - If you indicate a group, you will see the movements of all the accounts belonging to that group.
- When you are in the Budget table, you can access the account card with a click on the icon next to the account.
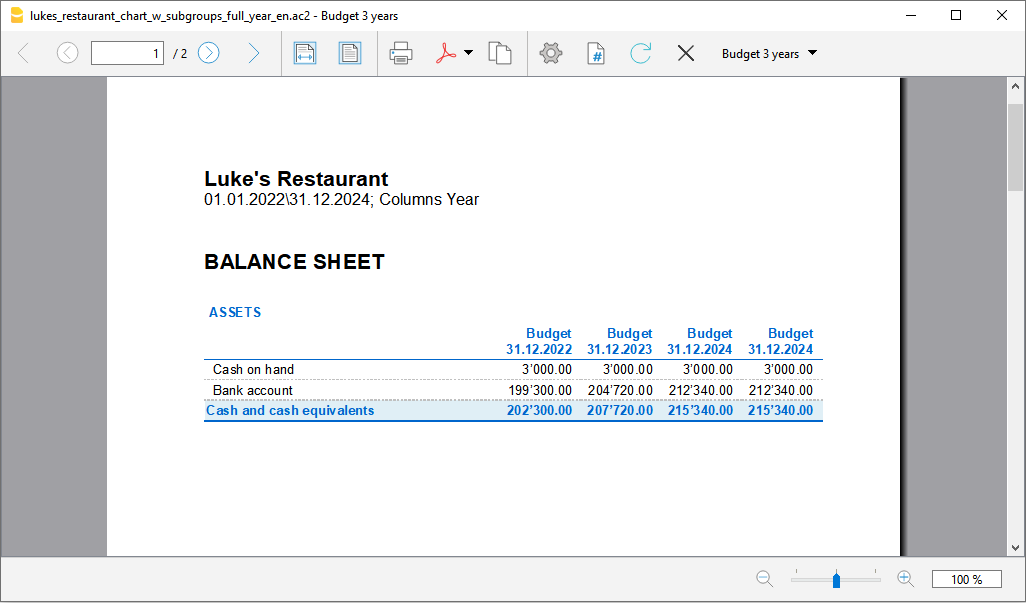
Liquidity in the Enhanced Balance sheet with groups
In the Enhanced Balance Sheet with groups you may select to work with values subdivided by column per period. In this way you can see the evolution of liquidity by day, week, month, quarter, semester, year, etc.
- In Sections options indicate the display of the Budget data.
- Select the Liquidity group.
You can choose to also display the liquidity accounts. - Set up the Period.
If a period that exceeds the accounting period, is indicated, the program will automatically switch to budgeting over several years. - Indicate the subdivision by period required.
- If you think you will use this print setting again, create a Customization.
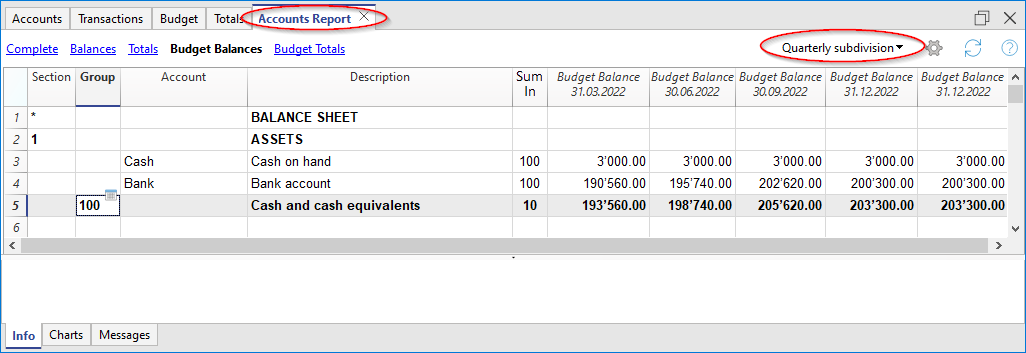
Budget Liquidity Accounting Report
The Accounting Report is similar to the Enhanced balance sheet with groups, with the difference that the display of the data takes place in the Accounts table in columns.
You can therefore use the Accounting Report to get an instant view of the evolution of liquidity accounts.