In this article
Sales for a company are the main source of income and liquidity. Unlike costs that are more easily planned, sales are more difficult to budget. As a rule of thumb, you may base yourself on the figure of the sales of the previous year for the same period or, on the possibility important events that are in the pipeline and could lead to an increase in sales or even to the acquisition of new customers.
Based on this concept, Banana accounting, with the forecast based on double-entry accounting, allows you to simulate and project different scenarios over time. Just change the budgeted amounts for sales and the program automatically updates the forecasts and displays detailed reports for the current year or for future years.
The sales projections are calculated on the basis of the forecasts included in the Budget table and can be displayed in different ways.
Accounts table
Set up accounts and sales groups in the Accounts table. In the Budget column you will also have the updated forecast balances for the accounting period. You can check what the evolution of sales will be during the year, at a glance
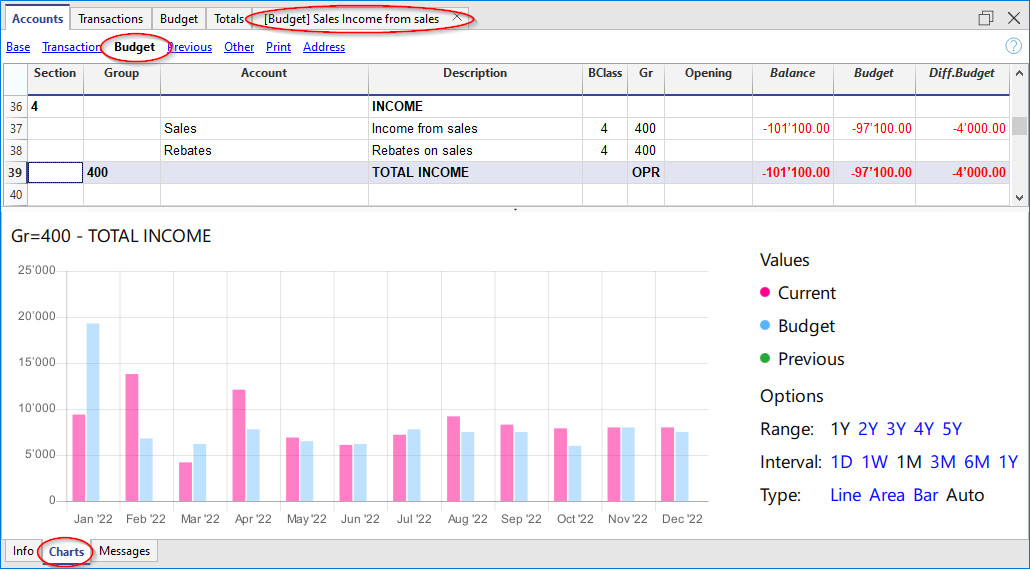
Evolution charts for sales
When you open the Charts window, positioning the cursor on an account or a group you will see the graph representing the evolution of the Sales.
In the legend are visible Current, Previous and Budget. By clicking on each one it is possible to hide or make visible the respective graphs.
Account card with Budget for sales
Using the Budget Account card command, all forecast movements of the account card are displayed. Day by day you will be able to see the evolution of sales and which movements will have the greatest impact.
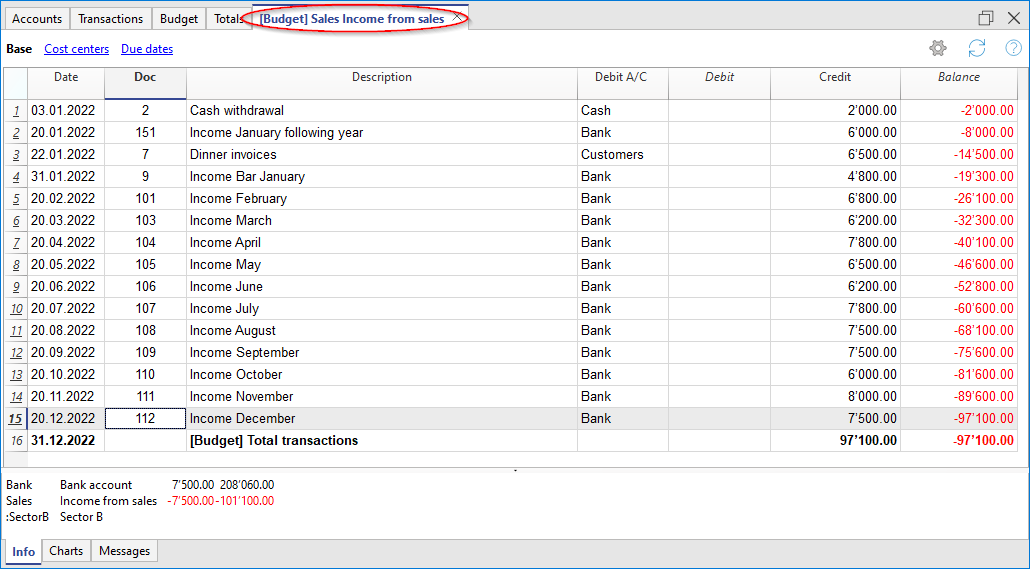
The Account card command allows you to specify if you want to display current or budgeted movements.
- Select the budget movements.
- Activate the account or group of Sales
You can also activate all sales accounts - Set the period.
- If you indicate a period that extends beyond the accounting period, the program will automatically generate Forecasts over several years.
- If you indicate a group, you will see the movements of all the accounts belonging to that group.
- When you are in the Budget table, you can access the account card with a click on the icon next to the account.
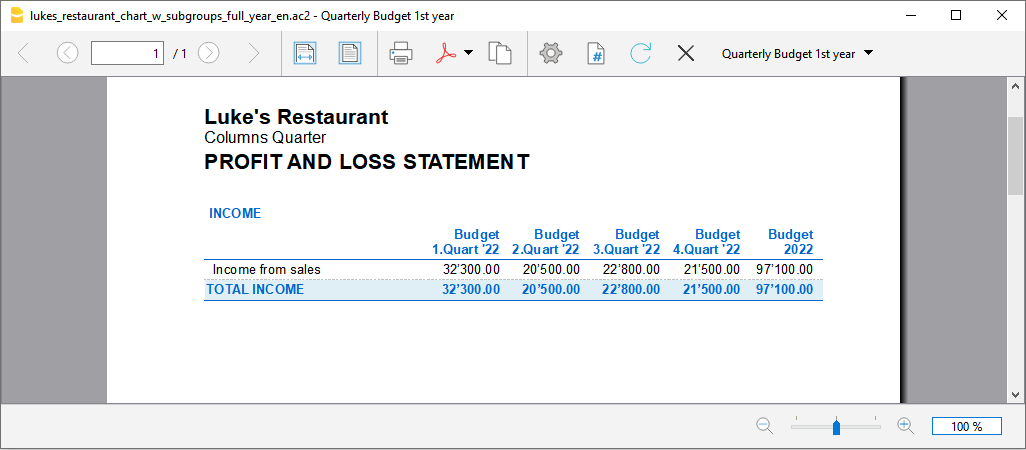
Income statement with Quarterly sales Budget
With the Enhanced Balance Sheet with groups you can choose which data columns to display and the reference period, to see the evolution of sales by day, week, month, quarter, semester, year, etc.
- In Sections options, you can select the Budget data to be displayed.
- Choose the sales group. You can choose to display sales accounts as well.
- Set up the Period.
If a period that exceeds the accounting period, is indicated, the program will automatically switch to budgeting over several years. - Indicate the subdivision by period required.
- If you think you will use this print setting again, create a Customization.
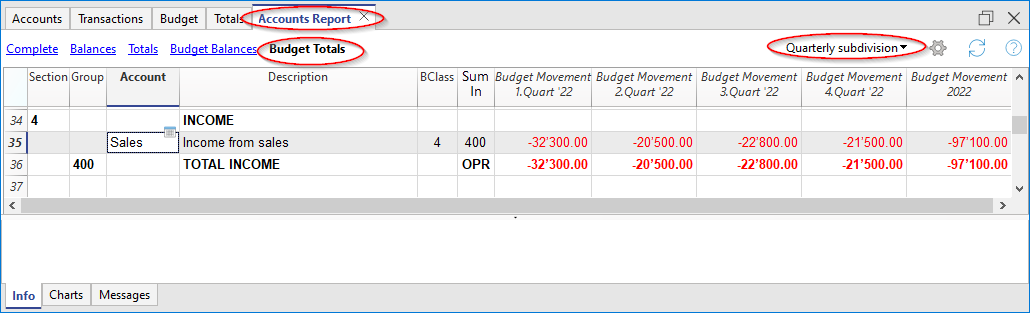
Accounting report with Sales estimate
The Accounting Report is similar to the Enhanced Balance Sheet with groups, with the difference that the data is displayed in columns, as in the Accounts table.
You can use the Accounting Report to have an instant view of the evolution of the sales accounts.