In this article
Banana has developed a very practical and immediate grouping system, which allows you to set in the Accounts table all the information necessary to define the structure of the Balance sheet, Profit & loss statement and of other sections of the accounting.
The grouping system is flexible; it allows you to implement any national chart of accounts and at the same time to adapt it to the specific needs of your business. Both very simple and very complex plans and presentations can be created, with multiple levels of totalling, for any type of accounting.
With grouping, the totals of balances, movements and the group budget are displayed immediately.
How it works
To understand how the Banana grouping system works, please refer to our documentation page:
Grouping and totalling system
The Banana grouping and totaling system is based on two columns of the Accounts and Categories table:
- Group (Total row)
- When, in a row, a group identifier is being entered, the row becomes a total row.
- In this row the amounts of the Sum in column, that contain the same identifier, are being totaled.
- In a row, when a group is present, there cannot be an account.
- Sum in
- Sums the row amounts in the indicated group.
- For each account or group row, you indicate the group in which the line is to be totaled.
- The number here must be one of the numbers defined in the Group column.
Main groups in double-entry accounting
Every accounting file template uses its own totaling system. Hereunder explanation of the main groups of double-entry accounting .
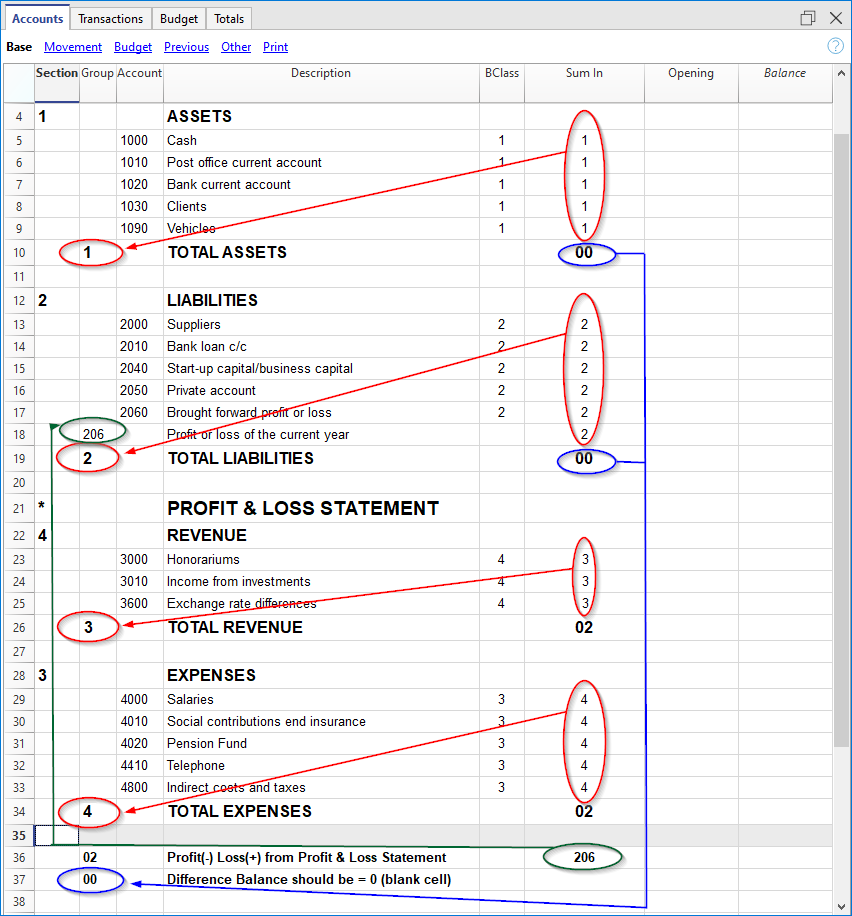
In double-entry accounting, the total of the Debit balances (positive) together with the Credit balances (negative) have to result in 0 (zero). In the case of differences, the group line 00 has a non-zero amount.
The calculation sequence to achieve 00 is therefore as follows:
- The 1000 accounts > group 1 (Total Assets) > Group 00
- The 2000 accounts > group 2 (Total Liabilities) > Group 00
- The 4000 accounts > group 4 (Total Expenses) > Group 02 (result Profit & Loss Statement) > Group 206 (Profit/Loss of the current year in the Balance Sheet) > Group 2 (Total Liabilities) > Group 00.
- The 3000 accounts > group 3 (Total Revenue) > Group 02 (result Profit & Loss Statement) > Group 206 (Profit/Loss of the current year in the Balance Sheet) > Group 2 (Total Liabilities) > Group 00.
- The 00 group is the control row where all the amounts are being added together.
- It is the "Grand total" of all the Debit & Credit balances as a result of the transactions entered in the Transactions table.
- If the line in the 00 group shows a difference (non-zero amount), this means that there are mistakes:
- If the difference is shown in the Accounts table, Opening column (all views) there are differences in the opening balances
- If the difference is shown in the Accounts table, Balance column (all views) there are differences in the Transactions table. In the Debit and Credit columns of the movement view, the totals are not balanced.
In cases where the difference is indicated issue the command Check and recalculate accounting. This command suggests any errors that need to be checked and corrected.
- In the Debit and Credit columns of the Movement view (Accounts table), the totals of the balances are always reported. If the totals in the two columns are equal, there are no errors.
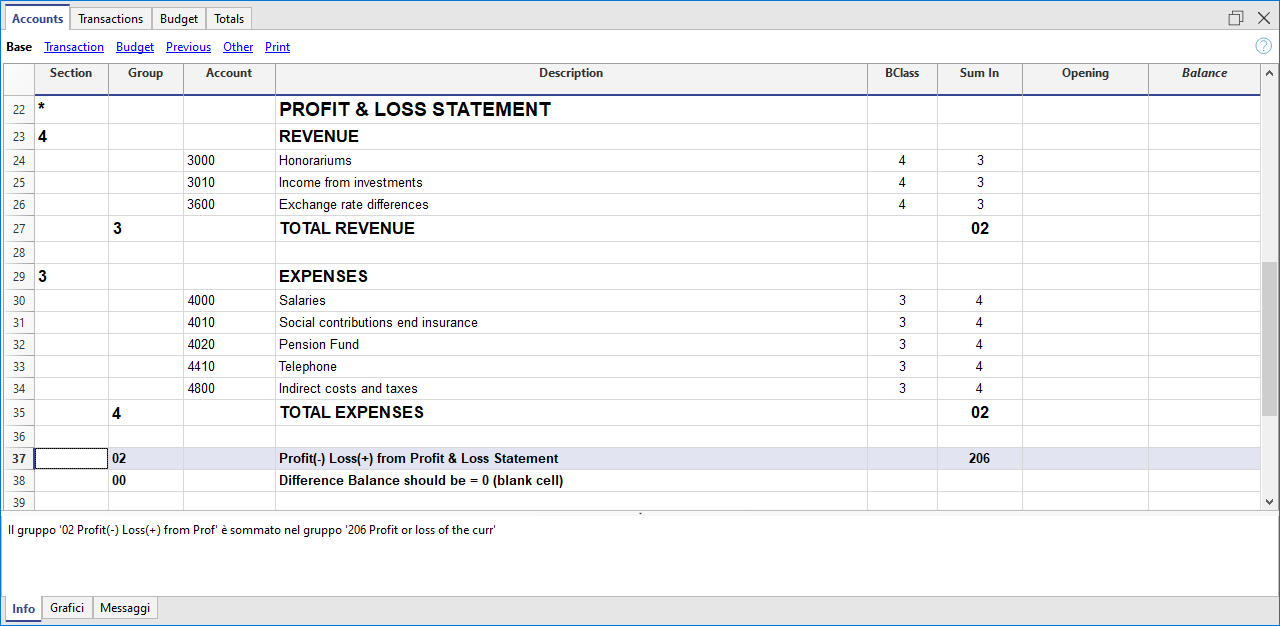
The result of Profit & loss statement is added in equity capital
As you can see in the example, the Group 02 (Profit /Loss from Profit & Loss statement) is totalized in the 206 liabilities group (current year result).
With this group organization, we have several advantages:
- The current year operating result is displayed in the balance sheet
- The Total Liabilities will match the Total Assets (provided that there is no accounting error).
Set up of the Chart of Accounts structure
The chart of accounts in Banana Accounting can be set mainly in two different ways:
1. Structure without subgroups (or subtotals).
In this case, the structure is very simple. You list all accounts without subgroups, and total all accounts or categories in the main groups:
For Double-entry Accounting:
- Assets
- Liabilities
- Expenses
- Revenue
For Income/Expense Accounting or Cash Manager (Categories table):
- Income
- Expenses
2. Structure with subgroups
The structure is more complex. The accounts or categories of the main groups are divided into several subgroups, which in turn are totaled into the corresponding main groups.
Here we present a structure of the chart of accounts with an example of Subdivision with subgroups in Double-entry Accounting. Each subgroup can be in turn :
Assets
- Current Assets
- Cash and Cash equivalents
- Customers
- Inventory
- Fixed Assets
- Furniture
- Machinery and equipment
- Computers, software.
- Current Assets
Liabilities
- Third-party capital
- Suppliers
- Bank loans
- Other short-term debts
- Long-term debts
- Equity
- Equity
- Reserve funds
- Profit and loss carried forward
- Profit for the year
- Third-party capital
From the Accounts table, at any time, through the menu File > Print or Print Preview you can print the chart of accounts or part of it.
Always starting from the Accounts table, by selecting the Movement view, you have the printing of the verification balance.
Adding a new group
- Position yourself in the row preceding the one where the new group will be entered
- Add a row with the command Edit > Add Row
- Type in the group column the group number, description, and the number of the column Sum in where you want this group to be totaled.
Adding a totaling level
With this system it is easy to add totaling levels.
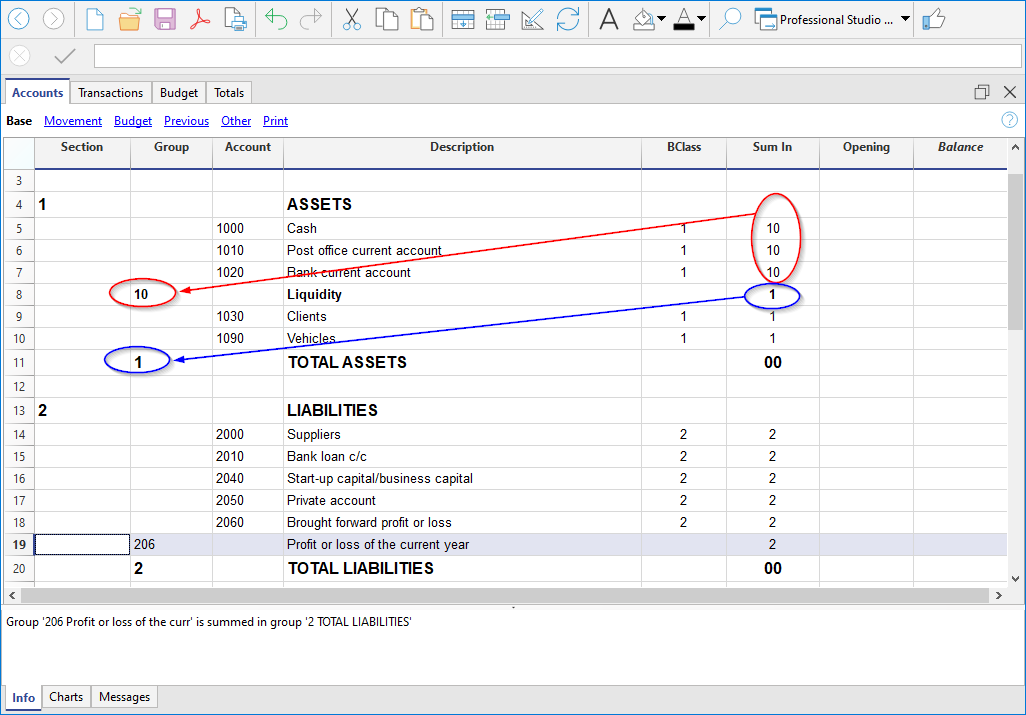
When we want to create a subgroup for the Cash & Cash equivalents accounts:
- Enter an empty row after the bank account
- Enter the value 10 into the Group column
- Enter the value 1 into the Sum in column
- Indicate the grouping 10 in columns Sum in the accounts 1000 and 1020
- The sequence for the calculation becomes:
The 1000 account > Group 10 (Cash & Cash equivalents) > Group 1 (Total Assets) > Group 00.
The programme totals the following:
- It totals the accounts in a group row.
For example, the Cash account is totalled in the Liquidity group. - Totallises a group or subgroup in another group, which in turn is totalled in another group, thus building the calculation structure of the Balance Sheet and Income Statement.
For example, the Liquidity group is totalled in Total Assets, which in turn will be totalled in group 00, in the control total row.
In case you want to insert another subgroup, "Current Assets", proceed in the same way.
- Add an empty row above the row of the Total Assets.
- In the new row:
- Indicate the number 11 in the Group column
- Indicate the number 1 in the Sum in column
- In the Clients and Goods for resale (inventory) rows, indicate the grouping 11 in column Sum in.
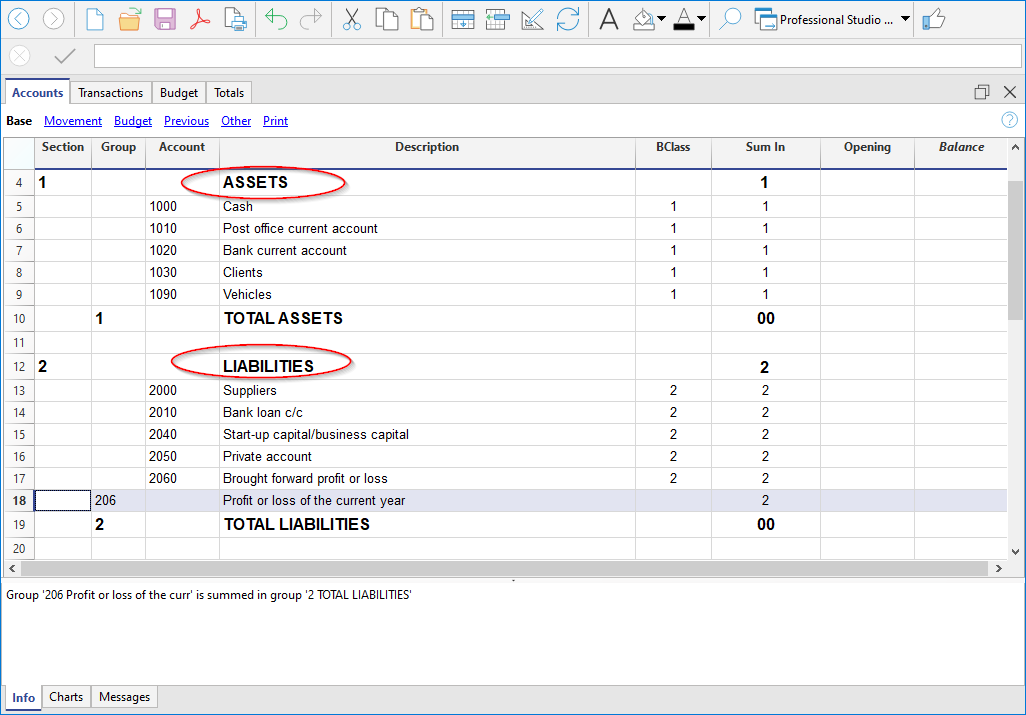
Title rows (with Sum in)
Also in the title rows it is useful to indicate the grouping Sum in (the group of the total row) to which it belongs.
In this way, in the printouts of the Enhanced Balance Sheet by groups, if the accounts are zero, the title will not be printed.
Deleting subgroups
In case the Chart of accounts shows subgroups that are no longer needed or not wanted, these can be deleted. Just delete the row of the subgroup and modify the grouping Sum in of every account that was part of that subgroup.
Checking of the structure
Once the Chart of accounts has been set up, execute the Actions menu > Check accounting command. In case there are errors, the program issues a warning.
Infinite loop error
This warning appears when a Group is being totaled in a Group of a lower level, reason for which an infinite error loop is being created.
There would be an infinite loop when, in the preceding example, the Assets Group (1) would be totaled in Group 10.
The program, after having calculated the Group 1, would total the amount in Group 10, which in turn would total the amount in Group 1, and then again in 10 without ending.
Profit & Loss Statement with Gross Profit
It is also possible to use a Profit & Loss Statement that starts with the total Business result and that subtracts the costs.
Hereunder the example of the Swiss PME Chart of Accounts is shown.
Related Documents