In this article
There are several ways to access financial forecasting data. You can access all the information that interests you.
- Provisional Balance sheet
- Provisional Profit and Loss Account
- Liquidity Planning
- Forecasting sales
- Financial forecasting for customers
- Financial forecasting for suppliers
- Investments Planning
- Corporate finance Planning
- Project Planning
- Planning with segments
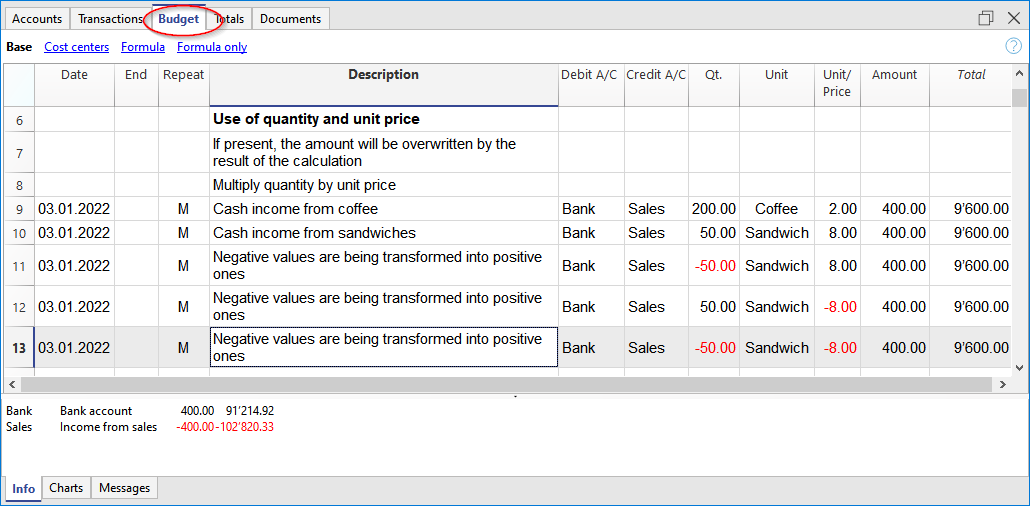
Budget table: Total column
The Total column contains the total amount of the budget for the accounting period indicated in the file and accounting properties (accounting start and end date). This delivers an instant indication of how much a certain expense will be for the current year.
For further information refer to Budget table columns and Dates and repetitions.
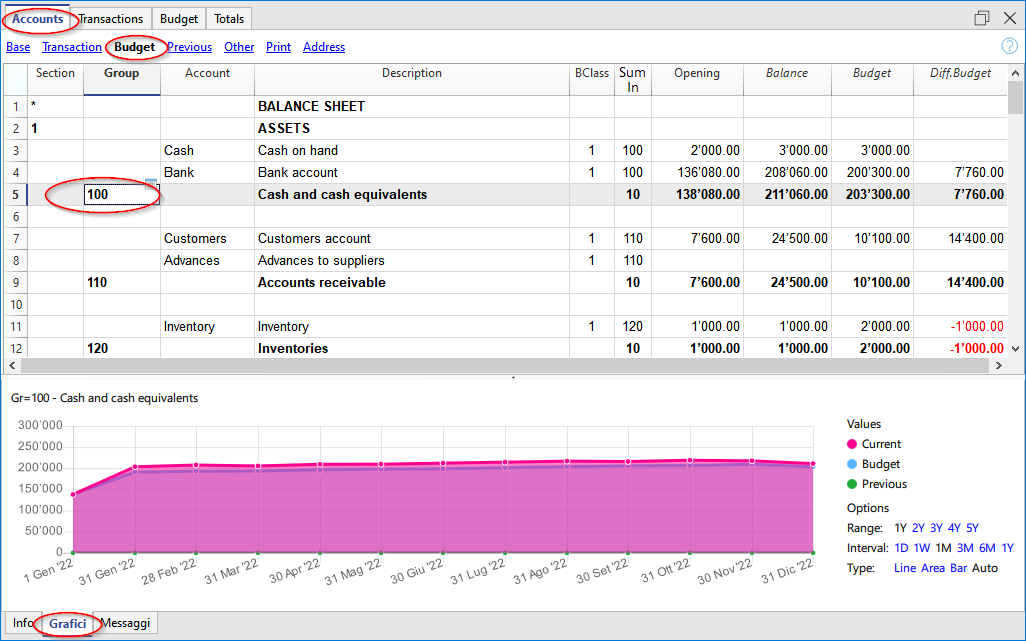
Evolution Charts - Charts window
In any table you are in, you will see the evolution of the account or group, on which the cursor is located, in the Charts window.
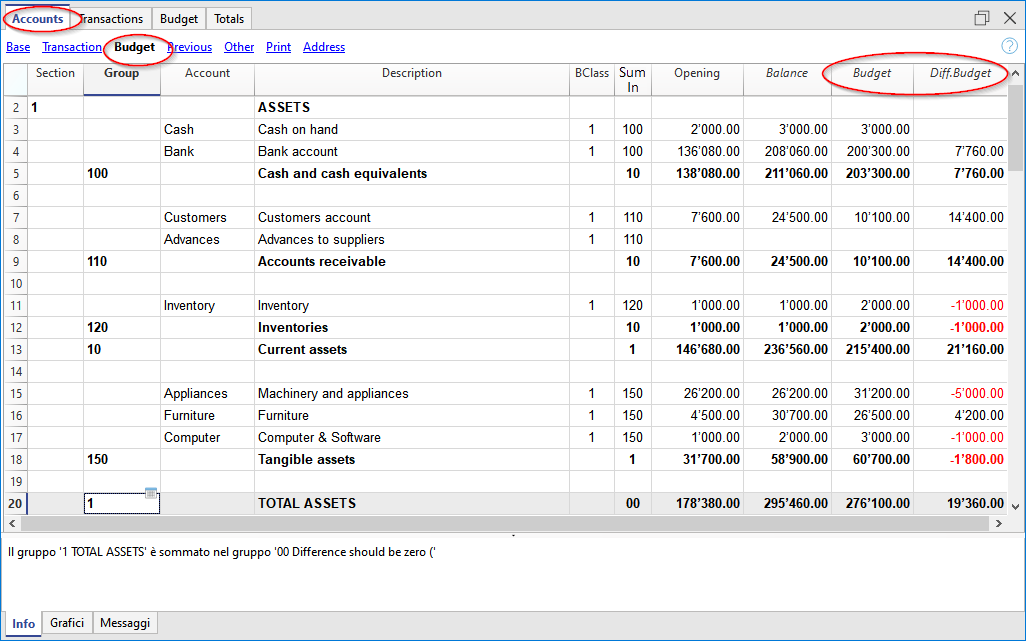
Budget column in the Accounts and Categories table
The Accounts and Categories table displays the updated budget values for the accounting period indicated in the file and accounting properties (accounting start and end date).
- Budget column
Indicates the total budget of the account for the accounting period.
The value indicated is inclusive of the initial balance and budget movements for the period. - Budget difference Column
Indicates the difference between the Budget and Balance column.
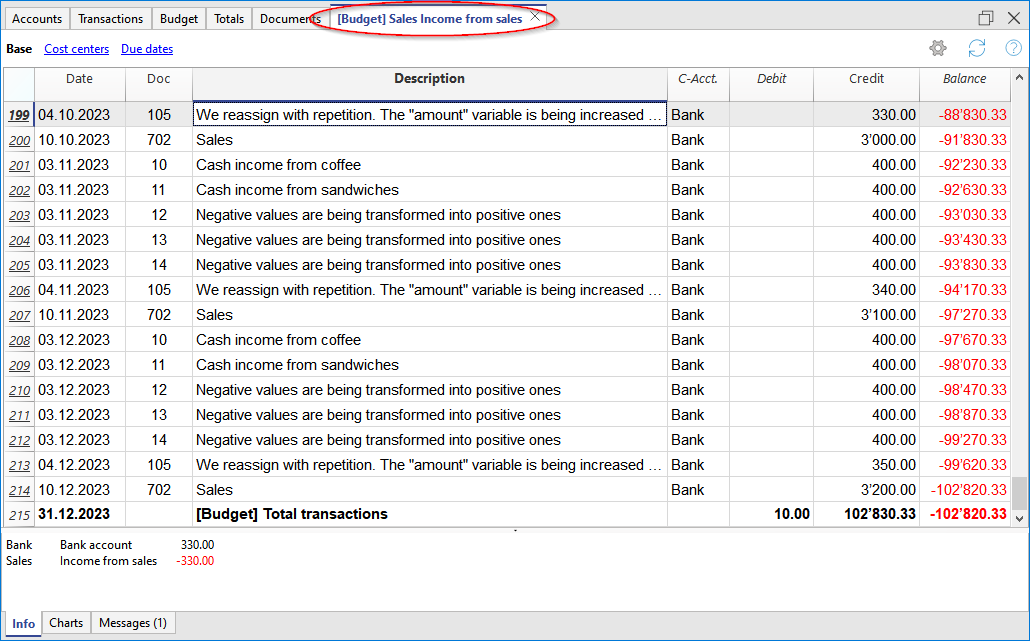
Account card with budget data
Via the Account card command, or in the Budget table, you can get the detail with all the forecast movements, by clicking on the button next to the account.
- In the Account card dialogue
- You can choose the account, cost center, group or segment whose movements you want to view.
- You can choose to view current data or budget data.
- In the Period accounting card, you can indicate the calculation period. If you choose an end date, beyond the accounting dates, the program automatically creates a projection of the indicated data.
- By opening the account card from the Budget table, the card for budget movements is displayed.
Enhanced Balance Sheet with groups
All the prints that are available for accounting, can include financial forecasts.
- It is sufficient to set up the Budget and Budget difference columns.
- In the Period Section, indicate the desired forecast period. You can also indicate a period over several years and the program immediately calculates and displays the forecast.
- In the Subdivision Section, you can select to display data by month, quarter, year or by choosing a segment.
Watch the video tutorial that shows how to create and print the Enhanced Balance Sheet with groups.
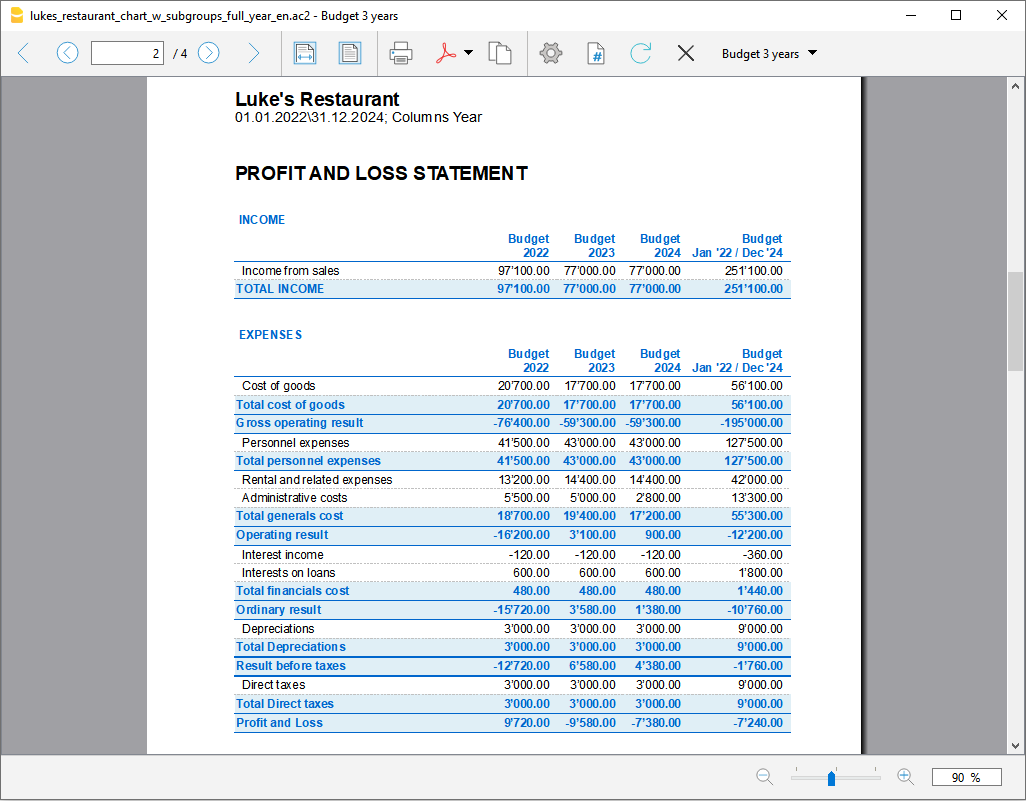
All customizations available in accounting are also applicable for planning:
- Select the desired grouping level.
Presentation with the account details or only with groups. - Choice of sections to include.
Balance Sheet only, Income Statement, Cost Centers can be printed. - Choice of the accounting period.
If you choose an accounting period beyond the accounting dates, the program automatically creates the projections up to the indicated date. - Breakdown by period (monthly, quarterly, half-yearly, annual).
By combining the calculation period and the frequency, ad hoc reports can be created.- By indicating a 1 year period without subdivisions, the forecast for the year is obtained.
- By indicating a 1 year period with quarterly subdivision, there is a printout with the columns for each quarter.
- By indicating a 6 months period with monthly subdivision, the month by month evolution can be seen in detail.
- By indicating a 5 years period with annual subdivision the columns with the evolution for the 5 years is available.
- Comparison between current and budget values.
- Addition of other columns.
- Change of print style.
- Saving Print Setups.
Print settings can be saved as a composition and can be recalled later.
You can create as many compositions as you require.