In this article
Basic Double-entry accounting for Accounting Teaching

The perfect template for teaching double-entry accounting to students. The Banana Accounting Plus software has a table-based interface, similar to Excel, which keeps the heart of accounting visible: the journal with the Debit and Credit columns.
Open in Banana WebApp
Run Banana Accounting Plus on your browser without any installation. Customize the template, enter the transactions and save the file on your computer.
Open template in WebAppTemplate documentation
This template presents a very simple chart of accounts, ideal for teaching the basics of double-entry accounting, with Assets, Liabilities, Costs and Revenues, without subgroups.
For more information on Education:
- Accounting Education page
- Free subscription of Banana Plus for schools
- Teacher Tools: extension for Accounting exercises preparation and correction
To learn how to use Banana Accounting:
Chart of Accounts
The Chart of Accounts, with Balance Sheet and Income Statement at a glance, is visible in the Accounts table.
It can be adapted by modifying, adding, and deleting accounts, according to the needs. More details on how to set up the chart of accounts are available in the online lesson Chart of Accounts.
An important aspect is that from an IT perspective, accounting software generally relies on the equation "Debits = Credits", which is rewritten as "Debits - Credits = 0". The developers have chosen to maintain this format, so debit amounts are associated by the system with the plus sign "+," while credit amounts are associated with the minus sign "-".

Opening Balances
In the Opening column, you enter the opening balances of Assets and Liabilities. Liabilities balances are entered with a minus sign in front.
Journal and Transactions
The Transactions table is the core of Banana Accounting and is used to enter double-entry accounting transactions. Students perform all operations here: they practice entering data, check it, and can correct any mistakes at any time.
To enter transactions in the journal, you need to complete the following columns:
- Date, eventual document number
- Description
- Debit Account
- Credit Account
- Amount
Individual transactions can take the form of a single row or be composed of multiple rows (if more than two accounts are involved). This is exactly the same as in the traditional paper form, but quicker thanks to the use of the computer.
After each transaction, the balances of the accounts (in the Accounts table) are automatically updated. This way, students can immediately see the impact of each operation, and the accounting is always in order.

Balance Column
Thanks to the Balance Column, students can instantly see if there are any accounting errors or anomalies and correct the data entered immediately.

Account cards
The Account Cards correspond to the ledgers and therefore show the movements of each individual account. They report the initial balance, the variations due to the entries made in the journal, and the resulting final balance.
Balance Sheet and Profit & Loss Statement
Once the accounting transactions have been entered, you can obtain the Balance Sheet and Profit & Loss Statement. The Chart of Accounts, which has already been automatically and instantly completed with the final balances, already shows the final Balance Sheet and Profit & Loss Statement.
Thanks to the Report > Enhanced Balance Sheet with Groups command, you can obtain an orderly and well-crafted presentation of the Balance Sheet and Profit & Loss Statement to be saved in PDF or printed out. They are "enhanced" and reproduced in a traditional style for presentation purposes.
The statements can be customised by choosing the sections to be printed, the period, the subdivision of the period and more.

Balance Sheet Analysis
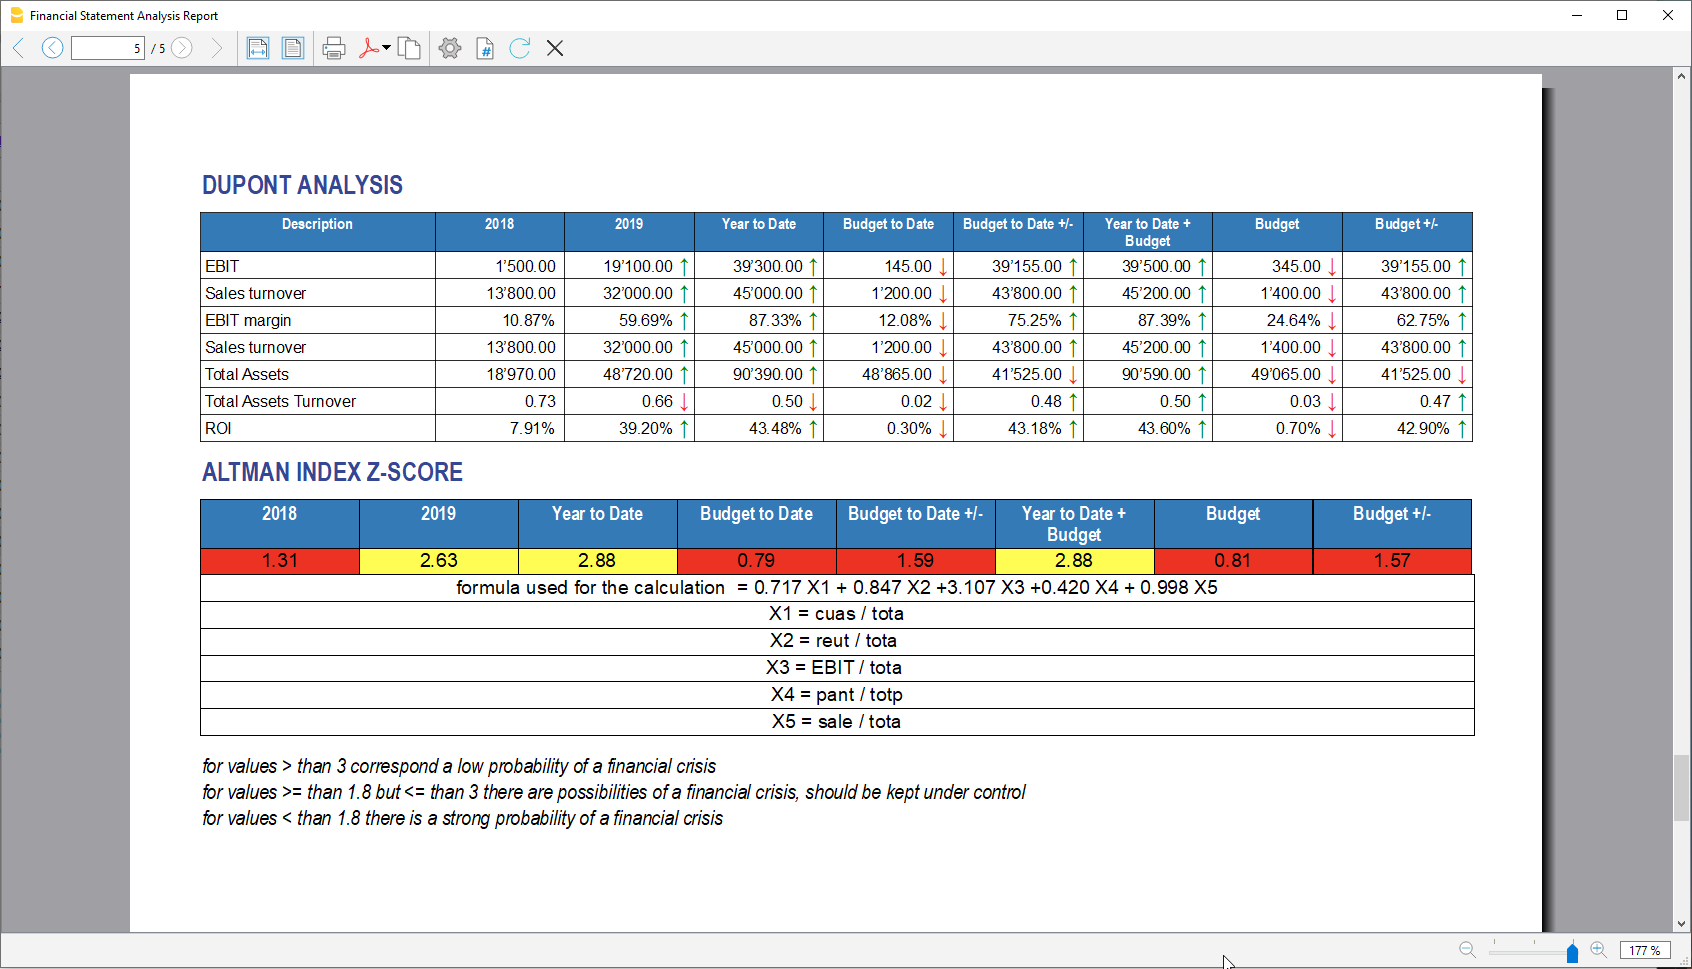
By means of a special extension, from the menu Extensions > Cash Flow Statements and Financial Ratios, you can automatically obtain a report in PDF format containing:
- Liquidity ratios (Cash ratio, Quick ratio, Current ratio)
- Profitability ratios (ROE, ROI, ROS, ... )
- Efficiency ratios
- Cash Flow
- DuPont Analysis and Altman Index Z-Score
