Reports financial forecasting
There are several ways to access financial forecasting data. You can access all the information that interests you.
- Provisional Balance sheet
- Provisional Profit and Loss Account
- Liquidity Planning
- Forecasting sales
- Financial forecasting for customers
- Financial forecasting for suppliers
- Investments Planning
- Corporate finance Planning
- Project Planning
- Planning with segments
Budget table: Total column
The Total column contains the total amount of the budget for the accounting period indicated in the file and accounting properties (accounting start and end date). This delivers an instant indication of how much a certain expense will be for the current year.
For further information refer to Budget table columns and Dates and repetitions.
Evolution Charts - Charts window
In any table you are in, you will see the evolution of the account or group, on which the cursor is located, in the Charts window.

Budget column in the Accounts and Categories table
The Accounts and Categories table displays the updated budget values for the accounting period indicated in the file and accounting properties (accounting start and end date).
- Budget column
Indicates the total budget of the account for the accounting period.
The value indicated is inclusive of the initial balance and budget movements for the period. - Budget difference Column
Indicates the difference between the Budget and Balance column.

Account card with budget data
Via the Account card command, or in the Budget table, you can get the detail with all the forecast movements, by clicking on the button next to the account.
- In the Account card dialogue
- You can choose the account, cost center, group or segment whose movements you want to view.
- You can choose to view current data or budget data.
- In the Period accounting card, you can indicate the calculation period. If you choose an end date, beyond the accounting dates, the program automatically creates a projection of the indicated data.
- By opening the account card from the Budget table, the card for budget movements is displayed.
Enhanced Balance Sheet with groups
All the prints that are available for accounting, can include financial forecasts.
- It is sufficient to set up the Budget and Budget difference columns.
- In the Period Section, indicate the desired forecast period. You can also indicate a period over several years and the program immediately calculates and displays the forecast.
- In the Subdivision Section, you can select to display data by month, quarter, year or by choosing a segment.
Watch the video tutorial that shows how to create and print the Enhanced Balance Sheet with groups.
All customizations available in accounting are also applicable for planning:
- Select the desired grouping level.
Presentation with the account details or only with groups. - Choice of sections to include.
Balance Sheet only, Income Statement, Cost Centers can be printed. - Choice of the accounting period.
If you choose an accounting period beyond the accounting dates, the program automatically creates the projections up to the indicated date. - Breakdown by period (monthly, quarterly, half-yearly, annual).
By combining the calculation period and the frequency, ad hoc reports can be created.- By indicating a 1 year period without subdivisions, the forecast for the year is obtained.
- By indicating a 1 year period with quarterly subdivision, there is a printout with the columns for each quarter.
- By indicating a 6 months period with monthly subdivision, the month by month evolution can be seen in detail.
- By indicating a 5 years period with annual subdivision the columns with the evolution for the 5 years is available.
- Comparison between current and budget values.
- Addition of other columns.
- Change of print style.
- Saving Print Setups.
Print settings can be saved as a composition and can be recalled later.
You can create as many compositions as you require.
Provisional Profit and Loss account
The Profit & Loss statement forecast presents the profits, costs and result for a future period. It is an important tool for tracking the management of the company which allows you to understand how the situation will evolve, from an economic and financial point of view.
With Banana Accounting, thanks to the forecasts with the double entry method, you have complete forecast budgets that you can organize in different ways. The program also calculates forecasts over several years.
You can have a very precise vision of the evolution of the economical situation.
The structure of the Profit & Loss statement is the same as that used in accounting file. When printing, you can indicate which values to display, those of the final balance, or the budgeted balance or of both.
The forecast values are calculated taking into account the opening balances and forecast movements indicated in the Budget table. When you change a budget entry, the forecasts are instantly updated. You can simulate and test, relocate a payment, add an investment, modify sales and see how the profit and loss statement changes over time.
Profit and Loss statement values can be displayed in several ways.
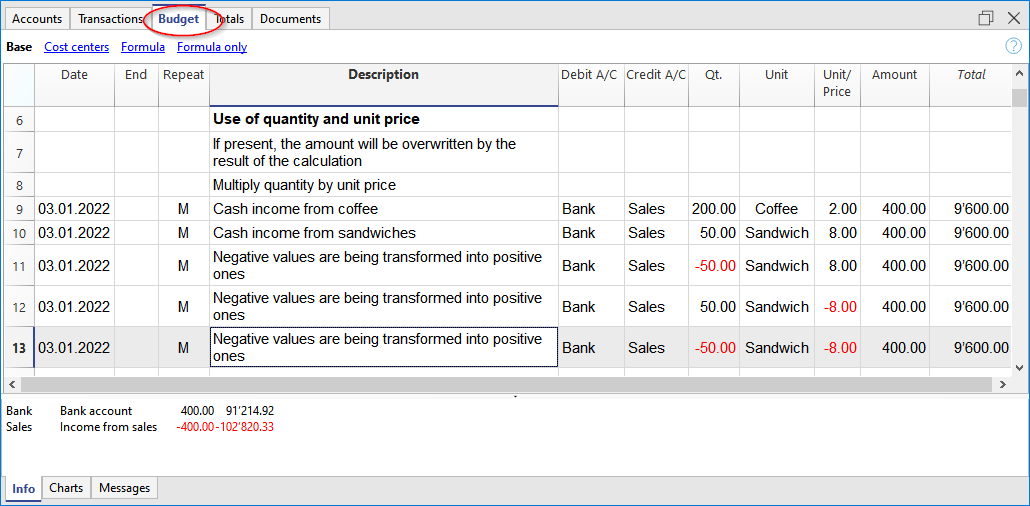
Use of quantities and formulas
The quantity and price columns of the Budget table allow you to prepare more realistic forecasts, using the same methodology as spreadsheets. This allows for faster simulations. It is sufficient that you change the price and you access the new forecasts of the Profit & Loss statement automatically and also those of the Balance Sheet and Liquidity.
The formulas allow you to automate cost calculation, so that for example, when you change sales the purchase costs change in percentage. In this way you can use precise income statement forecasts that update automatically. Formulas are particularly useful when making forecasts over multiple years.
Detailed forecasts
The Income statement forecast, based on the double entry method, allows you to obtain the forecasts of the costs and revenues, using the same accounts and groups as those of the accounting file. The same structure of the items, that make up the income statements, is used for forecasting. Values and reports are available automatically to display in detail, day by day, how liquidity evolves and the situation of customers.
The structure of the Chart of Accounts, on which the forecast is also based, is customizable. This can be done by simply using the main groups and the accounts that are part of it, or more in a more complex way, by also inserting subgroups, for a more detailed view.
The structure of the Profit and Loss Account is gradually scaled and allows you to view the interim and final results for the year after paying the taxes.
PROFIT AND LOSS STATEMENT
- Revenues.
- Cost of goods.
Gross operating result (total of Revenues and Costs).
- Staff costs
- General costs.
Operating result (total of the gross operating result, personnel costs and general costs).
- Financial costs.
Operating result before taxes and depreciation(Total of operating result and financial costs).
- Depreciation.
Operating result before taxes (Total of ordinary Result and Depreciation).
- Taxes
Net operating result (total of the Result before taxes and Taxes and duties).
Accounts / Category Table
In the Accounts table, for Double entry accounting, and in the Categories table for Income and Expense accounting, the forecast values for all the accounts (or categories) and groups of the Profit and Loss statement are displayed. With a glance you have an instant view of the forecasted Profit and Loss statement. The values refer to the accounting period and the variations are compared to the current balance.
If you require more details, you can add accounts or groups.

Profit and loss with groups
Through Enhanced Balance Sheet with groups command, you can view the Provisional Profit and Loss Statement, choosing the presentation mode you need.
- Indicate in the Sections options to display the values of the Budget
You can display the current (accounting) values, the budget values or both. - Set up the Period.
If a period that exceeds the accounting period, is indicated, the program will automatically switch to budgeting over several years. - Indicate the subdivision by period required.
- In the Rows section, you can exclude accounts and thus have a view of groups only.
- If you think you're use this print setting again, create a Customization.
Using the different options you can customize your prints. Below are some examples.
Annual Budget Profit and loss
This print was set up with only the budget values for the current year.
You can also display the change as an amount and a percentage.

Budget Profit and loss statement and current year comparison
The final (current) values are compared with those of the forecast.

Quarterly forecast Profit and loss statement
In the Subdivision section set quarterly and the program shows the forecast Profit and Loss statement for the various quarters.
The evolution of the budget forecast during the year will now be displayed.

Budget and quarterly Profit and loss statement
This print is set up to print the budget and the final balance. Thus we have the budget and current situation for the quarters.

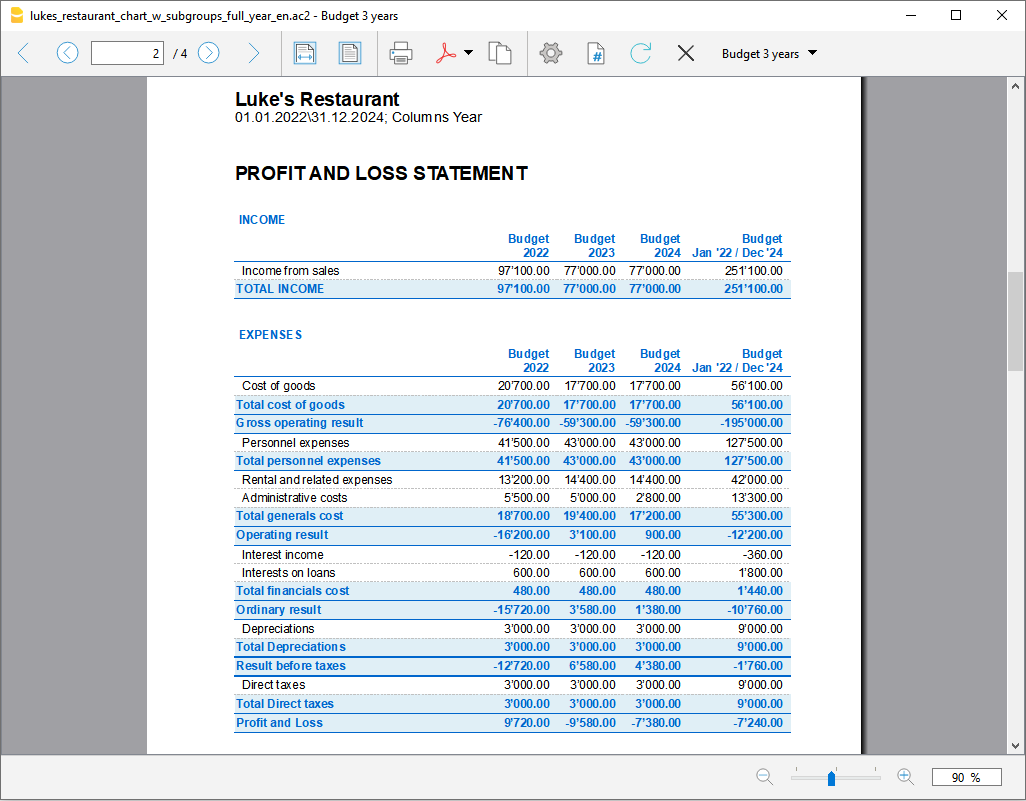
Three-year forecast for Profit and Loss account
If you insert the forecast movements with the repetition code, the program is able to prepare forecasts beyond the defined period.
To obtain forecasts over several years, the transactions are entered in the Budget table with repetition (Y).
The printout is set up to obtain the estimate of the Profit and Loss statement over three years.

Accounting Report for Budget Profit and Loss
From the Reports → Accounting Report menu you can get printouts of the Profit and Loss Statement displayed as in the accounts table, but with the required column values.
The options are similar to those explained for the Enhanced Balance Sheet by groups.

Liquidity Planning
Cash is King is the motto that indicates how important liquidity is. It is the main engine for carrying out business activities, meeting commitments and producing profits. To invest safely, it is essential to evaluate the ability to produce liquidity and its evolution over time a rational way.
The financial forecast of Banana Accounting is an important business management tool, which allows you to understand if there will be enough financial means to meet commitments and reduce your debt exposure to the maximum.
Liquidity projections are calculated on the basis of the initial balance and forecasts included in the Budget table. When a budget movement is changed, the forecasts are instantly updated. You can run different simulations, assign a payment, add an investment, modify sales and see how liquidity evolves.
Liquidity values can be displayed in several ways.
Accounts table
Set up accounts and liquidity groups in the Accounts table. In the Budget column you will also see the updated forecast balances for the accounting period. At a glance you will know what the liquidity situation will be at the end of the year.

Evolution graphs
When you open the Charts window, positioning the cursor on an account or a group you will see the graph representing the evolution of Liquidity.
In the legend are visible Current, Previous and Budget. By clicking on each one it is possible to hide or make visible the respective graphs.
Account card with Budget Group liquidity
Using the Budget Account card command, all forecast movements of the account card are displayed. Day by day you can see which movements will have an impact on the liquidity.

The Account card command allows you to specify if you want to see current or budgeted movements.
- Select budget movements.
- Set the period
If you indicate a period that exceed the accounting period, the program will automatically generate Forecasts over several years. - If you indicate a group, you will see the movements of all the accounts belonging to that group.
- When you are in the Budget table, you can access the account card with a click on the icon next to the account.
Liquidity in the Enhanced Balance sheet with groups
In the Enhanced Balance Sheet with groups you may select to work with values subdivided by column per period. In this way you can see the evolution of liquidity by day, week, month, quarter, semester, year, etc.
- In Sections options indicate the display of the Budget data.
- Select the Liquidity group.
You can choose to also display the liquidity accounts. - Set up the Period.
If a period that exceeds the accounting period, is indicated, the program will automatically switch to budgeting over several years. - Indicate the subdivision by period required.
- If you think you will use this print setting again, create a Customization.

Budget Liquidity Accounting Report
The Accounting Report is similar to the Enhanced balance sheet with groups, with the difference that the display of the data takes place in the Accounts table in columns.
You can therefore use the Accounting Report to get an instant view of the evolution of liquidity accounts.

Forecasting sales
Sales for a company are the main source of income and liquidity. Unlike costs that are more easily planned, sales are more difficult to budget. As a rule of thumb, you may base yourself on the figure of the sales of the previous year for the same period or, on the possibility important events that are in the pipeline and could lead to an increase in sales or even to the acquisition of new customers.
Based on this concept, Banana accounting, with the forecast based on double-entry accounting, allows you to simulate and project different scenarios over time. Just change the budgeted amounts for sales and the program automatically updates the forecasts and displays detailed reports for the current year or for future years.
The sales projections are calculated on the basis of the forecasts included in the Budget table and can be displayed in different ways.
Accounts table
Set up accounts and sales groups in the Accounts table. In the Budget column you will also have the updated forecast balances for the accounting period. You can check what the evolution of sales will be during the year, at a glance

Evolution charts for sales
When you open the Charts window, positioning the cursor on an account or a group you will see the graph representing the evolution of the Sales.
In the legend are visible Current, Previous and Budget. By clicking on each one it is possible to hide or make visible the respective graphs.
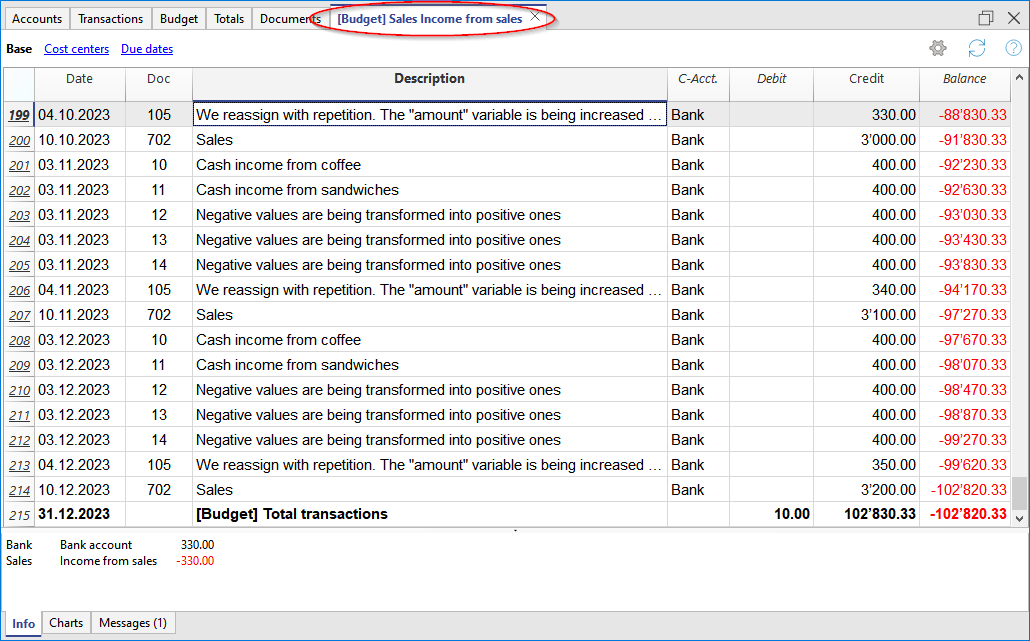
Account card with Budget for sales
Using the Budget Account card command, all forecast movements of the account card are displayed. Day by day you will be able to see the evolution of sales and which movements will have the greatest impact.

The Account card command allows you to specify if you want to display current or budgeted movements.
- Select the budget movements.
- Activate the account or group of Sales
You can also activate all sales accounts - Set the period.
- If you indicate a period that extends beyond the accounting period, the program will automatically generate Forecasts over several years.
- If you indicate a group, you will see the movements of all the accounts belonging to that group.
- When you are in the Budget table, you can access the account card with a click on the icon next to the account.
Income statement with Quarterly sales Budget
With the Enhanced Balance Sheet with groups you can choose which data columns to display and the reference period, to see the evolution of sales by day, week, month, quarter, semester, year, etc.
- In Sections options, you can select the Budget data to be displayed.
- Choose the sales group. You can choose to display sales accounts as well.
- Set up the Period.
If a period that exceeds the accounting period, is indicated, the program will automatically switch to budgeting over several years. - Indicate the subdivision by period required.
- If you think you will use this print setting again, create a Customization.

Accounting report with Sales estimate
The Accounting Report is similar to the Enhanced Balance Sheet with groups, with the difference that the data is displayed in columns, as in the Accounts table.
You can use the Accounting Report to have an instant view of the evolution of the sales accounts.

Financial forecasting for customers
Customers forecasting completes financial planning with customer data. For example, a company can forecast sales by indicating accounts for the most important customers.
Forecasting with the double entry method also allows you to indicate accounts for individual customers. Depending on the requirement, customer management can be done with balance sheet accounts, profit and loss accounts or with cost and profit centers.
When changing a budget movement, the forecasts for each customer are also updated individually.
Accounts table
Set up the customers in the Accounts table. In the Budget column, the forecast balances are automatically updated for the accounting period. At a glance, you can view what the forecast for the individual customer will be.

Evolution chart
When you open the Charts window, positioning the cursor on an account or a group you will see the graph representing the evolution of the Customers.
In the legend are visible Current, Previous and Budget. By clicking on each one it is possible to hide or make visible the respective graphs.
Customer Account card with budget data
With the Budget Account card command you have the possibility to see in detail all the movements for each customer.

- Select Budget movements.
- Indicate the customer account or group.
- Set up the period.
If you indicate a period that extends beyond the accounting period, the program will automatically generate Forecasts over several years. - When indicating a group, you will see the movements of all the accounts belonging to that group.
- When in the Budget table, you can access the customer's card with a click on the small icon next to the account number.
Customers in Enhanced Balance sheet with groups
With the Enhanced Balance Sheet with groups you can choose which data columns to display and the reference period, to see the evolution of the customer by day, week, month, quarter, semester, year, etc.
- In Sections options you can select the Budget data to be displayed.
- Choose the Customers group. You can choose to also view the accounts of each individual customer.
- Set up the Period.
If a period that exceeds the accounting period, is indicated, the program will automatically switch to budgeting over several years. - Indicate the subdivision by period required.
- If you think you will use this print setting again, create a Customization.

Accounting Report with Customers Budget
The Accounting Report is similar to the one for Enhanced balance sheet with groups, with the difference that the display takes place in columns, as in the Accounts table.
You can therefore use it to get an instant view of the evolution of customer accounts.

Provisional Balance Sheet
The Balance Sheet forecast displays the Balance Sheet for a future period. It is an important tool for tracking the management of your company and allows you to verify what the company's capital structure, the state of assets, of liabilities and the equity will be like.
With Banana Accounting, thanks to the forecasting with the double entry method, you have complete forecast budgets and that you can arrange in different ways. The program also calculates forecasts over several years.
You can access a very precise vision of what the future balance sheet will look like.
The structure of the budget is the same as that one used in the accounting file. When printing, you can indicate which values to display, those of the final balance, the budget or both of those.
The forecast values are calculated taking into account the opening balances and forecast movements indicated in the Budget table. When you change a budget entry, the forecasts are instantly updated. You can simulate and test, relocate a payment, add an investment, modify sales and see how the budget changes over time.
Budget forecast values can be displayed in several ways.
Detailed forecast
The financial forecast, based on the double entry method, allows to obtain the forecasts of the balance sheet values, using the same accounts and groups as those of the accounting file. The same structure of the items that make up the financial statements is used for forecasting. Values and reports are available automatically to display in detail, day by day, how liquidity , the situation of customers evolves and many more.
The Banana Accounting forecast presents the values for assessing the financial, equity and economic situation. The structure is customizable, it can be presented in a simple way, including the main groups and the accounts that are part of it, or in a more complex way, by inserting subgroups, for a more detailed view.
| ASSETS | LIABILITIES |
Current assets
Fixed assets
| Third party capital
Equity
|
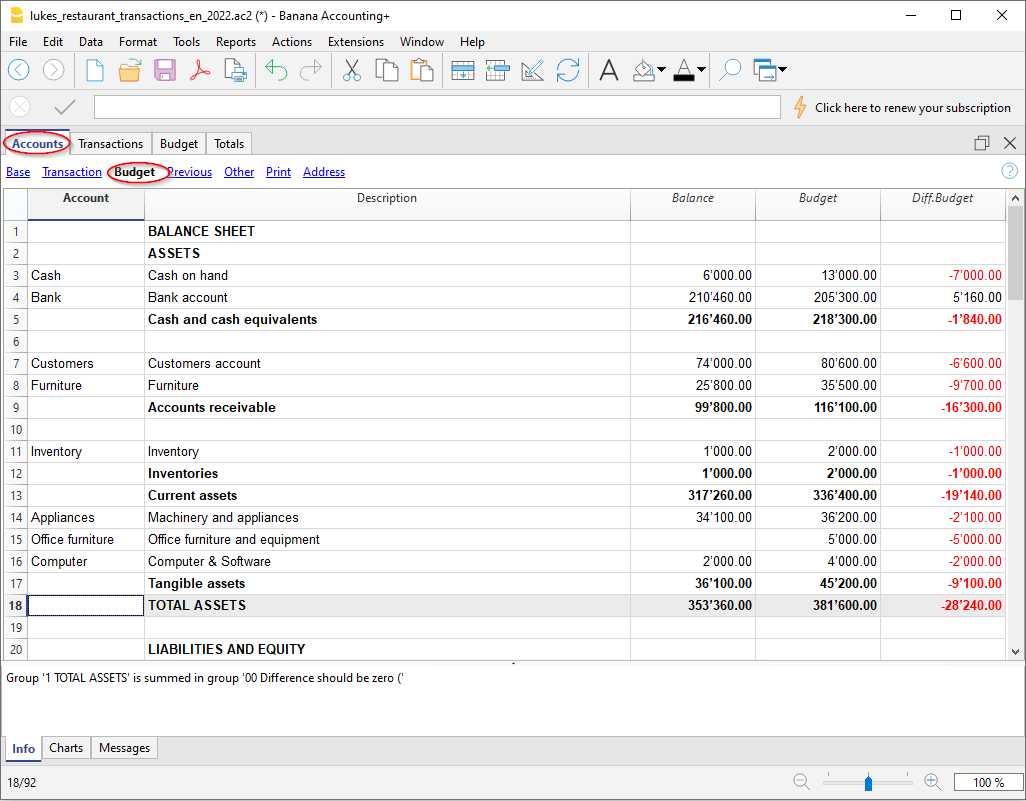
Accounts table
In the Budget column of the Accounts table you access forecast values for all accounts and balance groups available. In a glance you have an instant overview of the budget. The values refer to the accounting period and the variations are calculated automatically with respect to the current balance.
If you need more details, you can add accounts or groups.
Enhanced Balance sheet with groups
Through Enhanced Balance Sheet with groups command, you can view the Provisional Balance Sheet, choosing the presentation mode you need.
- Indicate in the Sections options to display the values of the Budget
You can display the current (accounting) values, the budget values or both. - Set up the Period.
If a period that exceeds the accounting period, is indicated, the program will automatically switch to budgeting over several years. - With the subdivision by period the data are presented with the subdivisions chosen for the period.
- In the Rows section, you can exclude accounts and thus have a view of groups only.
- If you think you will use this print setting again, create a Customization.
Using the different options you can customize your prints. Below are some examples.
Enhanced Balance sheet annual Budget groups
This print has been set up to produce only the budget values for the current year.
Budget and Current Balance sheet
The actual (current) values are compared with those of the budget. You can also display the change in the comparison as an amount and a percentage.

Quarterly budget
IIn order to obtain an annual budget with a quarterly breakdown, the quarter must be indicated in the section Subdivision → Subdivision by period. The program will show the budget for the year, divided into 4 quarters.
Budget and current quarter Balance sheet
This printout is set up to display both the budget and the annual final balance with the breakdown per quarter. Thus we have the expected and current situation at the end of the quarters.

Three-year budget
This printout is set up to print the three-year budget forecast.
In the Period section set the reference period to three years and in the Subdivision section → Subdivision per period set to one year. In the File properties (File menu) there must be 3 years as the start and end period (e.g. start 01.01.2022 - end 31.12.2024).
Budget Accounting Report
From the Reports → Accounting Report menu you can get printouts of financial statements displayed as in the accounts table, but with the required column values.
The options are similar to those explained for the Enhanced Balance Sheet by groups.

Financial forecasting for suppliers
Supplier forecasting completes financial planning with supplier data. For example, a company can plan purchases by indicating purchases by indicating accounts for the most important suppliers. It will thus be able to analyze and optimize the relationship with the various suppliers, perhaps by requesting payment extensions.
Forecasting with the double entry method also allows you to indicate accounts for individual suppliers. Depending on the need, suppliers management can be done with balance sheet accounts, profit and accounts or with cost and profit centers.
When changing a budget movement, the forecasts for each individual supplier are also updated.
Accounts table
Set up accounts for suppliers in the Accounts table. In the Budget column, the forecast balances are automatically updated for the accounting period, according to the beginning and the end date, set up in the File properties. At a glance, you can view what the forecast for the individual supplier will be.

Evolution chart
When you open the Charts window, positioning the cursor on an account or a group you will see the graph representing the evolution of Suppliers.
In the legend are visible Current, Previous and Budget. By clicking on each one it is possible to hide or make visible the respective graphs.
Account card with Supplier budget data
With the Budget account card command you have the possibility to see in detail all the movements for each supplier.

- Select budget movements.
- Indicate the supplier’s account ot the supplier's group.
- Set up the period.
If you indicate a period that extends beyond the accounting period, the program will automatically generate Forecasts over several years. - When indicating a group, you will see the movements of all the accounts belonging to that group.
- When in the Budget table, you can access the customer's card with a click on the small icon next to the account number.
Suppliers Enhanced Balance sheet with groups
Through the Enhanced Balance Sheet with groups you can choose which data columns to display and the reference period, to see the evolution of the supplier by day, week, month, quarter, semester, year, etc.

- In Sections options you can select the Budget data to be displayed.
- Select the Suppliers group. You can also choose to view the accounts of each individual supplier.
- Set up the Period.
If a period that exceeds the accounting period, is indicated, the program will automatically switch to budgeting over several years. - Indicate the subdivision by period required.
- If you think you will use this print setting again, create a Customization.
Accounting Report with Suppliers Budget
The Accounting Report is similar to the one for Enhanced balance sheet with groups, with the difference that the display takes place in columns, as in the Accounts table.
You can therefore use it to get an instant view of the evolution of the Supplier accounts.

Investments Planning
The investment plan presents the expected evolution of the equipment, stocks, movable or immovable values that are necessary for the company.
With Banana Accounting, thanks to the forecasting with the double-entry method, you can track what the evolution of assets will be over time. You generate comprehensive forecasts, which you can organize in different ways. The program also calculates forecasts over several years.
The structure of the accounts is identical to the one used for accounting. When printing, you can indicate whether to select which values to display, the final ones only, the forecasted ones or both together.
You also have the Income statement forecasts, so you can display the evolution of amortization and interest. When a budget movement is changed, the forecasts are immediately updated. You can run simulations, assign a payment, add an investment, change sales and see how asset accounts evolve.
For the Investment Plan, you have the same options as in the Liquidity Planning and the Provisional Profit and Loss Account.
Using formulas
The formulas allow you to automate calculation of depreciation and interest. When you increase an investment, the Profit and Loss statement will also be instantly be updated. Formulas are particularly useful when making forecasts over multiple years.
Chart of Accounts
In the Budget column of the Chart of Accounts the forecast values for all accounts and balance groups are displayed, and therefore, for all those relating to investments equally. With a glance, you have an instant view of the values referring to the accounting period.

If you require more investment details, you may add accounts or groups.
Evolution charts
When you open the Charts window, positioning the cursor on an account or a group you will see the graph representing the evolution of the Suppliers.
In the legend are visible Current, Previous and Budget. By clicking on each one it is possible to hide or make visible the respective graphs.
Investments Account card with Budget data
Using the Budget Account card command will offer you the possibility to see in detail, all movements of the budgeted investments. You have the evolution, day by day, of every single Assets account and also of the depreciation accounts.

The Account card command allows you to specify if you want to see current or budgeted movements.
- Select budget movements.
- Indicate the account or the Investments group.
- Set up the Period.
- If you indicate a period that exceeds the accounting period, the program will automatically generate Forecasts over several years.
- If you indicate a group, you will see the movements of all the accounts belonging to that group.
- When you are in the Budget table, you can access the account card with a click on the small icon next to the account.
Investments in the Enhanced Balance sheet with groups
Through Enhanced Balance Sheet with groups you can choose which data columns to display and the reference period, to see the evolution of the investments by day, week, month, quarter, semester, year, etc.
- In Sections options you can indicate to display the Budget data.
- Choose the Investments group. You can also choose to display the accounts of each individual asset relating to an investment.
- Set up the Period.
If a period that exceeds the accounting period, is indicated, the program will automatically switch to budgeting over several years. - Indicate the subdivision by period required.
- If you think you will use this print setting again, create a Customization.

Accounting Report with Investments Budget
The Accounting Report is similar to the one for Enhanced balance sheet with groups, with the difference that the display takes place in columns, as in the Accounts table.
You can therefore use it to get an instant view of the evolution of the investments accounts.

Corporate financing plan
The corporate financing plan presents the expected evolution of the accounts relative to the origin of third party and own capital.
With Banana Accounting, thanks to the forecasting with the double-entry method, you have complete forecasts that you can arrange in different ways. The program also calculates forecasts over several years.
The structure of the accounts is identical to the one used for accounting. When printing, you can indicate whether to select which values to display, the final ones only, the forecasted ones or both together.
When a budget movement is changed, the forecasts are immediately updated. You can run simulations, assign a payment, add a new debit, change sales and see how liabilities accounts evolve.
For the Corporate financing plan, you have the same options as for the Liquidity Planing and the Provisional Profit and Loss Account.
Using formulas
The formulas allow you to automate calculation of depreciation and interest.Formulas are particularly useful when making forecasts over multiple years.
Chart of Accounts
In the Budget column of the Chart of Accounts the forecast values for all accounts and balance groups are displayed, and therefore, also for all those relating to funding. With a glance you get an instant view of the values referring to the accounting period.

If you require more details on third party capital, you may add accounts or groups.
Evolution graphs
When you open the Charts window, positioning the cursor on an account or a group you will see the graph representing the evolution of the financing of the company.
In the legend are visible Current, Previous and Budget. By clicking on each one it is possible to hide or make visible the respective graphs.
Account card with Budget for third party capital data
Using the Budget Account card command you have the opportunity to see on a day-to-day basis, how each account payable evolves, debt amortization, interest expense and understand the impact they have on financing.

The Account card command allows you to specify if you want to see current or budgeted movements.
- Select budget movements.
- Indicate the account or group of loans.
- Set up the Period
If you indicate a period that exceed the accounting period, the program will automatically generate Forecasts over several years. - If you indicate a group, you will see the movements of all the accounts belonging to that group.
- When you are in the Budget table, you can access the account card with a click on the icon next to the account.
Enhanced Balance sheet with groups
Through Enhanced Balance Sheet with groups you can choose which data columns to display and the reference period, to see the evolution of the funding of the company by day, week, month, quarter, semester, year, etc.

- In Sections options you can indicate the Budget data to be displayed.
- Choose the Third party capital group. You can also select to display the accounts of each individual funding account.
- Set up the Period.
If a period that exceeds the accounting period, is indicated, the program will automatically switch to budgeting over several years. - Indicate the subdivision by period required.
- If you think you will use this print setting again, create a Customization.
Accounting Report for Third party capital Budget
The Accounting Report is similar to the one for Enhanced balance sheet with groups, with the difference that the display takes place in columns, as in the Accounts table.
You can therefore use it to get an instant view of the evolution of third party accounts.

Project planning with profit and cost centres
Financial planning of projects allows you to take control over the income and expenses of a project. It is used to evaluate investments and returns on a project and to track its implementation.
Budgeting with the double-entry method allows you to indicate profit and cost centers as well. You only need to set up cost centers for the different projects, and in parallel to the balance and income statement forecasts, you will have the forecasts available for each individual project.
- Watch the video: Cost and profit centers
The projections are calculated on the basis of the initial balance and the forecasts entered in the Budget table. When a line is changed the budget, forecasts are instantly updated. You can produce simulations, reassign a payment, add an investment, modify sales and spot how the project changes.
Values of projects can be displayed in several ways.
Accounts table
Profit and Cost centers are set up in the Accounts table. After each movement, the updated balances of the forecast for the accounting period of reference are displayed in the Budget column. At a glance you can know immediately what the situation of the projects will be at the end of the year.

Evolution chart
When you open the Charts window, positioning the cursor on an account or a group you will see the graph representing the evolution of the projects.
In the legend are visible Current, Previous and Budget. By clicking on each one it is possible to hide or make visible the respective graphs.
Account card with budget data
With the Budget Account card command you have the possibility to display all the movements for the single project in detail, day by day.

The Account Card command allows you to specify whether you want to display current or budget transactions.
- Select budget movements.
- Indicate the cost or profit center accounts, or the group.
- Set up the Period.
- If you indicate a period that extends beyond the accounting period, the program will automatically switch to Forecasts over several years.
- When you indicate a group, you will see the movements of all the accounts belonging to that group.
- When in the Budget table, you can access the cost center tab by clicking on the small icon next to the account number.
Enhanced Balance sheet with groups
With the Enhanced Balance sheet with groups you can choose which data columns to display and the reference period, to see the evolution of the projects by day, week, month, quarter, semester, year, etc.
- In Sections options you can select the Budget data to be displayed.
- Select the Projects group. You can also choose to view the accounts of each individual project.
- Set up the Period.
If you indicate a period that extends beyond the accounting period, the program will automatically switch to Forecasts over several years. - Indicate the desired subdivision by period.
- If you think of continuing to use this print setting, create a customization.
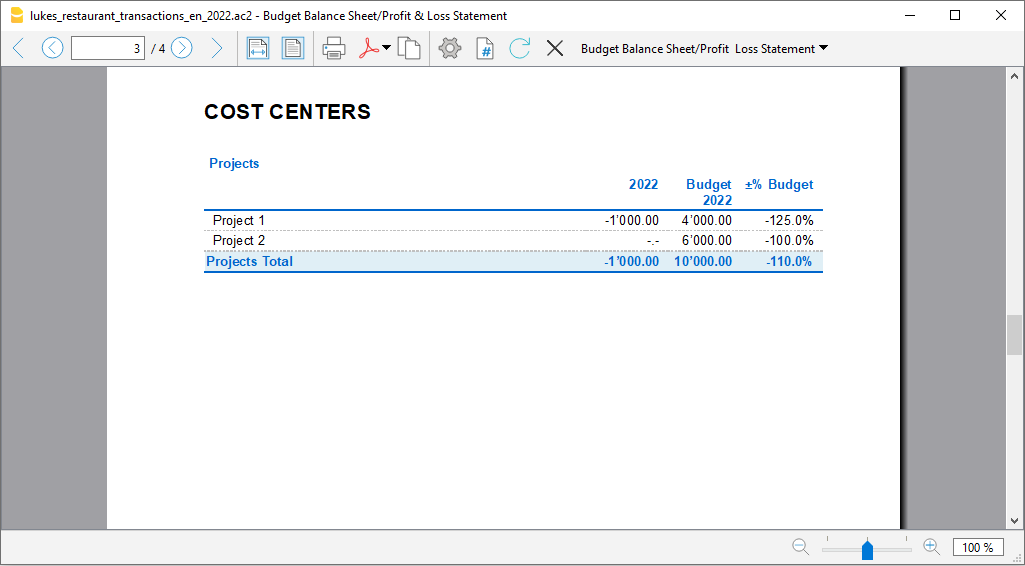
Projects Budget Accounting report
The Accounting report is similar to the Enhanced balance sheet with groups, with the difference that the display takes place in columns, as in the Accounts table.
It can therefore be used to display an instant view of the evolution of the projects.

Planning with segments per sector and branch
The financial planning by sectors allows you to run budget and income statement forecasts for each sector or branch of the company. With the Segments, you can then evaluate the different areas of the company and understand what contribution it makes to the overall business.
The forecast, with the double-entry method, also allows you to indicate the segments which are set in the Accounts table, at the end of the chart of accounts and are used both for accounting and forecasting. When recording the movements of the forecast, the accounts of the segments must be entered when necessary. Banana Accounting executes the Balance Sheet and Profit and Loss Statement of the forecast as well, with the subdivision by the different segments.
The projections are calculated on the basis of the initial balance and the forecasts entered in the Budget table. When a budget movement is changed , forecasts of the project are instantly updated. You can produce simulations, reassign a payment, add an investment, modify sales and spot how the project changes.
Sector or branch data with segments can be displayed in several ways.
Chart of Accounts
Segments are set up in the Chart of Accounts. When indicating the segments for the Balance Sheet and Profit and Loss statement accounts, the balance of the segment will always result as zero in the accounts.

Account card with Segments budget data
With the Budget Account card command you have the possibility to examine all the movements for each segment in detail.
 The Account card allows you to specify whether you want to display the current or budget movements.
- Select budget movements
- Indicate the required segment, or the group.
- Set up the Period.
If you indicate a period that extends beyond the accounting period, the program will automatically switch to Forecasts over several years. - If you indicate a group, you will see the movements of all the segments belonging to that group.
- When in the Budget table, you can access the Budget Account card by clicking on the small icon next to the account number.
Enhanced Balance sheet with groups
With the Enhanced Balance sheet with groups you can choose to divide the values into separate columns for each segment. Thus, you dispose of the Balance Sheet and Profit and Loss statement for each sector.
- Indicate that you wish to display the Budget values in the Columns section.
- In Sections you may choose to view the balance sheet or the profit and loss statement only.
- Set up the Period.
If you indicate a period that extends beyond the accounting period, the program will automatically switch to Forecasts over several years. - Indicate the required subdivision by segments.
- If you plan to continue to using this print setting, create a customization.

Accounting report for the Budget of Segments
The Accounting report is similar to the Enhanced balance sheet with groups, with the difference that, the display takes place in columns.
It can therefore be used to display an instant view of the evolution of the segments.
