In this article
It’s possible to access to the charts by going to the Extensions menu→Cash Flow Statements and financial Ratios →Financial Charts.
Charts allow you to read the same information as you can find in the report but in a clearer and more
intuitive way. Once the dialogue is open, you can move between the various elements thanks to a drop-down menu.
Ratios charts
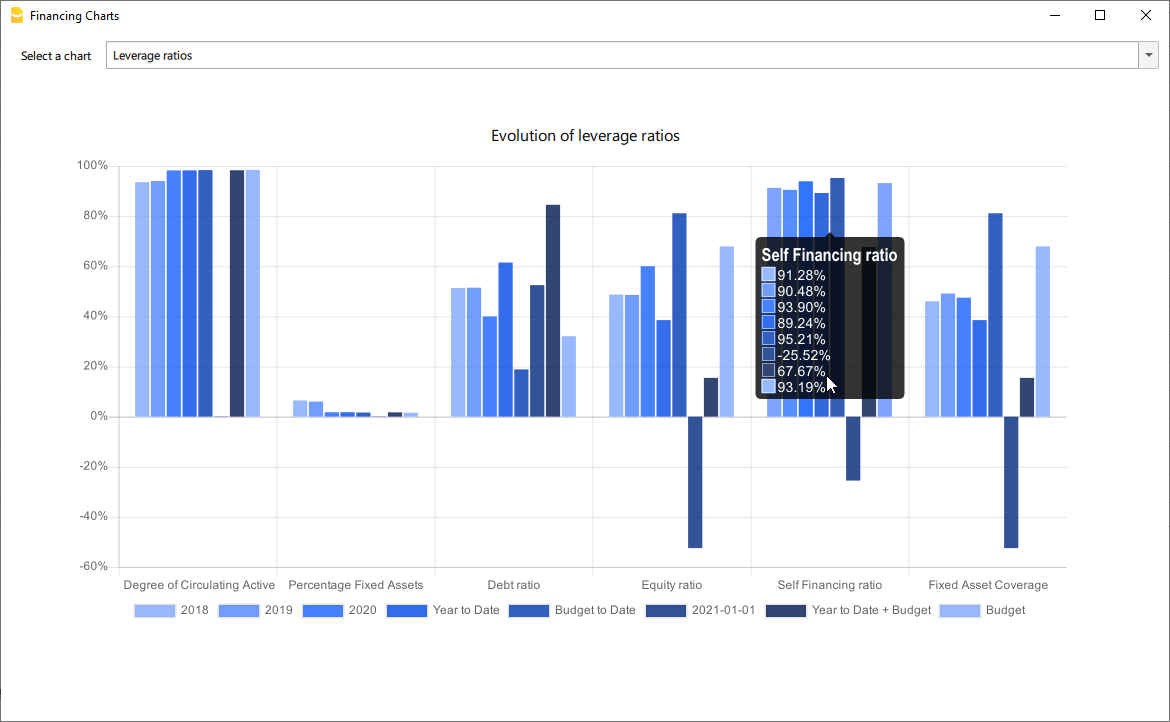
- Financing ratios evolution
- Liquidity ratios evolution
- Profitability ratios evolution
- Efficiency ratios evolution
- Cashflow ratios evolution
These charts represent the evolution of the indexes over time. For each type of index there is a bar chart,
within which there is a section that represents the evolution over time of each index for each year included
in the analysis.
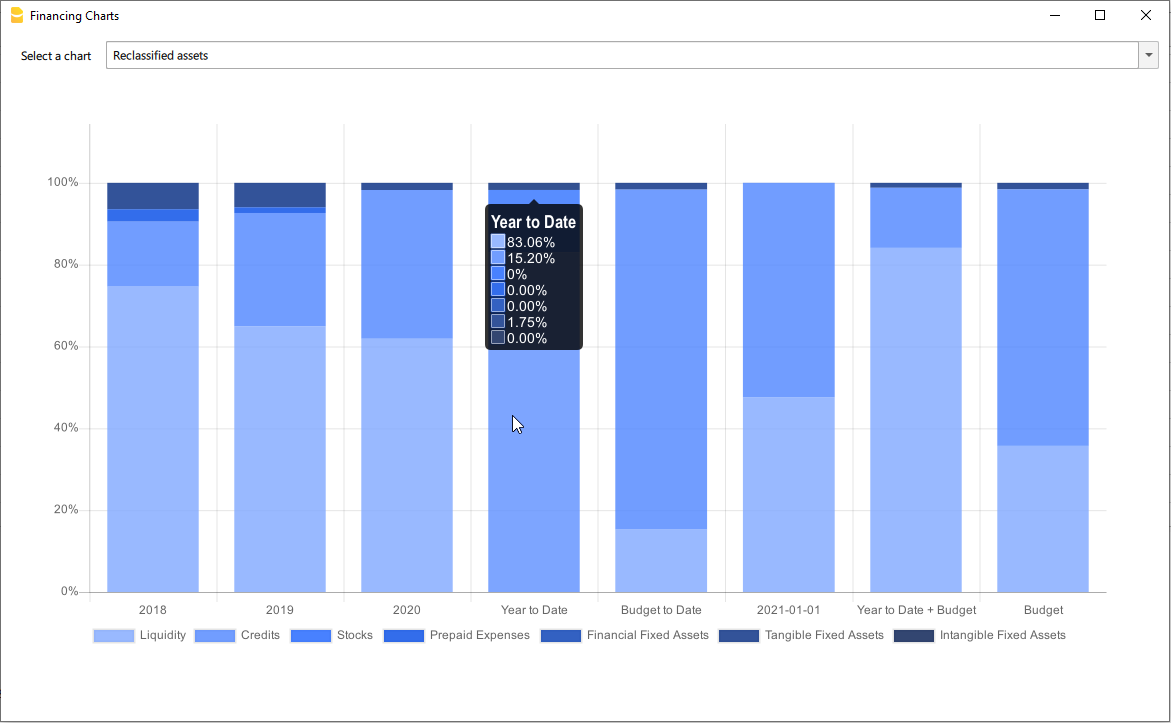
Reclassified Elements charts
- Reclassified asset variation
- Reclassified liabilities and equity variation
These charts show the time evolution of the reclassified assets, and reclassified liabilities, using stacked
chart. It is possible to see how and in what quantity the groups make up the total of assets and liabilities (in
percentage %)
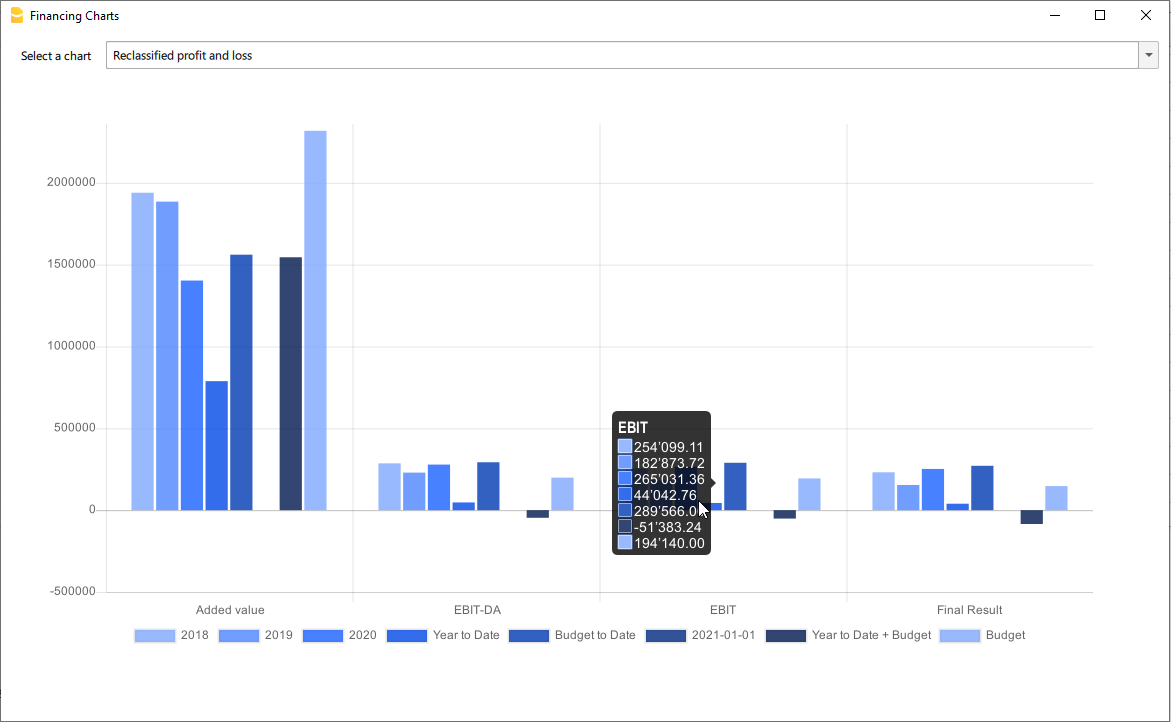
Reclassified profit and loss variation
Shows by using histogram the value of the intermediate totals (EBIT,EBIT-DA,..) of the reclassified profit and loss account ,and their evolution over the time.