In this article
Generate the Report by going to the Extensions menu→Cash Flow Statements and financial Ratios →Financial Reports.
The balance sheet ratios are formulas calculated on financial, economic and asset values. These ratios are derived from the income statement and balance sheet data. Balance sheet indices are important analysis tools that provide essential indications for the entrepreneur's activity.
It is widely used by all professionals who are interested in assessing the soundness of a company for their work.
In fact, banks use the balance sheet indexes to evaluate company loan applications.
the indexes are divided into four main types
- Liquidity ratios:
- Financing ratios
- Profitability ratios
- Efficiency ratios
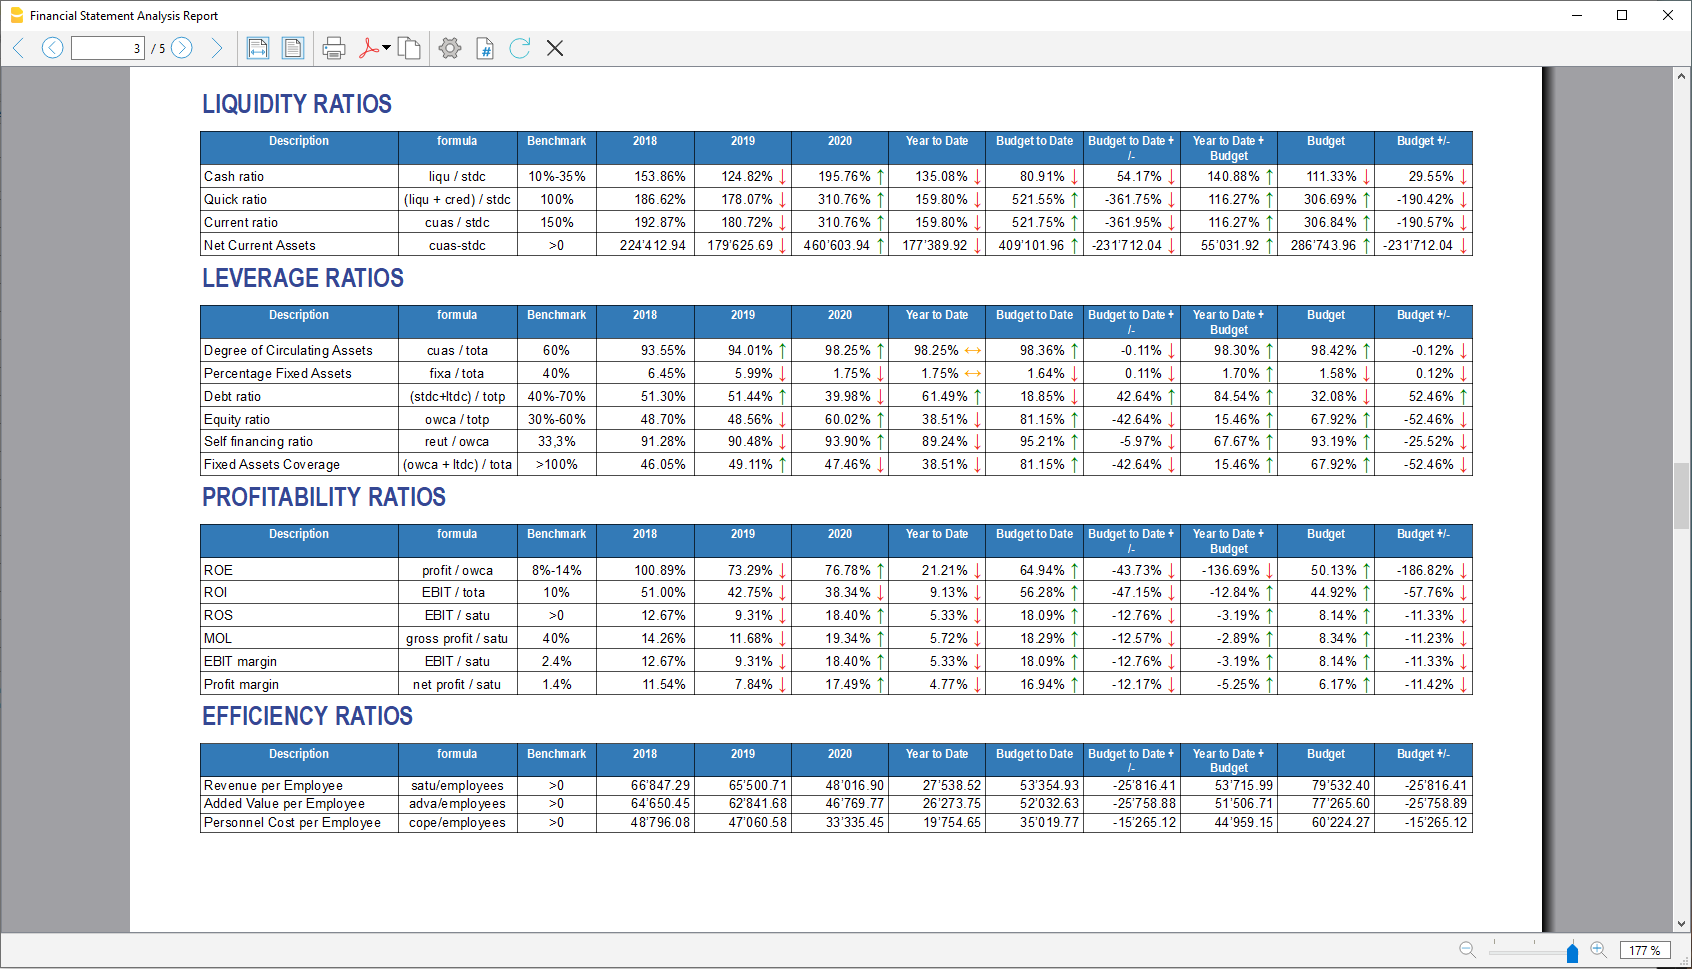
Liquidity ratios
An important class of financial metrics used to determine a debtor's ability to pay off current debt obligations without raising external capital. Liquidity ratios measure a company's ability to pay debt obligations and its margin of safety through the calculation of metrics.
- Cash ratio: Indicates the extent to which the company is able to repay its debts at the end of the term.
- Quick ratio: Indicates the extent to which the company is able to pay its debts when due.
- Current ratio: Indicates the extent to which the company is able to pay its short-term debts without touching fixed assets.
- Net Current Asset: Indicates the part of the current assets free of short-term commitments, which can therefore be used in the activity.
Financing ratios
They look at how much capital comes in the form of debt (loans) or assesses the ability of a company to meet its financial obligations.
- Degree of Circulating Assets: It allows us to understand whether there is a balance within the company's assets, a judgement can only be made if we have the average data for the same line of business.
- Percentage Fixed Assets: It is complementary to the previous one.
- Debt ratio: Indicates the extent to which the company has had to resort to external financing, the judgement depends very much on the branch of activity.
- Equity ratio: Is complementary to the previous one, equity ratio has the advantage of being less expensive.
- Self-Financing ratio: Indicates the extent to which the company has been able to accumulate undistributed profits.
- Fixed Asset coverage: The fixed assets must absolutely be financed from equity or possibly from long term capital, otherwise major repayment problems could occur.
Profitability ratios
Are useful to assess a business's ability to generate earnings relative to its revenue, operating costs, balance sheet assets, or shareholders' equity over time, using data from a specific point in time.
- Return on equity (ROE): By comparing the percentage obtained with the rates commonly applied for other investments, it is possible to understand whether the equity invested by the company gives a sufficient return or not.
- Return on investment (ROI): Identifies the return on invested capital. Basically it serves to understand how much the invested capital returns in terms of income.
- Gross Operating Margin (MOL) :Is a value that measures the profitability of a company. In other words, it measures the ability to make profit margins: Indicates the company's return on sales made.
- EBIT margin: Is the ratio of EBIT to turnover of a company. This ratio provides information on its profitability and helps to compare different companies and sectors.
- Profit margin: It represents what percentage of sales has turned into profits.
Efficiency ratios
Express the degree of efficiency of the company's factors of production, those chosen by us give us an indication of the relationship between the number of employees and the various margins of the profit and loss account. Efficiency indicators are related to profitability indicators, as higher productivity generates an improvement in profitability indicators.
- Revenue per Employee: An increase indicates greater efficiency of the company and a lowering of the break even point. Its increase is certainly an indicator of the good health of the company itself.
- Added Value per Employee: Gives evidence of efficiency in terms of cost reduction (e.g. economies of scale). If the revenue per capita index remains stable and the value added per capita index increases, this is evidence of cost efficiency.
- Personnel Cost per Employee: Highlights the trend in average personnel costs.
Within the tables and also visible the calculation formula of each index.