Budget und Finanzplanung
Banana Buchhaltung ist in der Lage, automatisch vollständige und detaillierte Finanzpläne für ein oder mehrere Jahre zu erstellen. Somit erhält man eine klare Vorstellung von der Zukunft eines Unternehmens, eines Vereins oder auch von den privaten Finanzen.
Es handelt sich um einen innovativen, einfacheren und schnelleren Weg, Finanzpläne zu erstellen. Nach Erfassung der prognostizierten Bewegungen in die Tabelle Budget, erstellt das Programm automatisch die Gewinn- und Verlustrechnung, die voraussichtliche Bilanz und den Liquiditätsplan mit allen Details.
Sie haben eine klare Zukunftsperspektive und können vorausplanen, um die Rentabilität und den Einsatz von Finanzmitteln zu verbessern.
Wenn Sie nur ein einfaches Budget für das Jahr benötigen, können Sie anstelle der Tabelle Budget die Spalte 'Budget' in der Tabelle Konten (Doppelte Buchhaltung) sowie Konten und Kategorien (Kassenbuch und Einnahmen-Ausgaben-Rechnung) verwenden und das Jahresbudget für jede Ein- und Ausgangsposition eingeben.
Der Kontenplan mit dem aktualisierten Budget
Die Planung verwendet den gleichen Kontenplan, wie derjenige der Buchhaltungsdatei.
In der Tabelle Konten (Doppelte Buchhaltung) sowie Konten und Kategorien (Kassenbuch und Einnahmen-Ausgaben-Rechnung) sehen Sie neben den aktuellen Salden auch die geplanten Budgetsalden.
Die Struktur der Bilanz und Erfolgsrechnung kann nach eigenem Ermessen durch Hinzufügen von Konten, Gruppen und Untergruppen angepasst werden.
Ausserdem können Sie Kosten- und Profitstellen, Segmente sowie Konten für Kunden und Lieferanten nutzen.

Die Tabelle Budget
Die Planung erfolgt durch Eingabe von Buchungen in der Tabelle Budget. Es wird gleich vorgegangen, wie wenn man in der Tabelle Buchungen Buchungszeilen eingibt, aber diese betreffen die Zukunft.
Die Miete und andere wiederkehrende Vorgänge werden nur einmal angegeben, indem die Wiederholungsoption und ein mögliches Enddatum festgelegt werden.
In der Spalte 'Total' wird die jährliche Summe angezeigt.
Sie können beliebig viele Zeilen hinzufügen, sowohl für das laufende Jahr als auch für die folgenden Jahre, und diese jederzeit ändern.

Eine klare und vollständige Zukunftsvision Ihrer Tätigkeit
Die Berichte, die für die Buchhaltung erstellt werden können, stehen Ihnen auch für das Budget bzw. die Finanzplanung zur Verfügung.
So können Sie schon bereits vor Beginn des Unternehmens wissen, wie profitabel Ihr Unternehmen voraussichtlich sein wird und über wie viel Liquidität Sie am Ende des Jahres verfügen werden.
- Bilanzvorschau
Liquiditäts-, End- und Zwischensalden werden für Sie genauestens angezeigt. - Vorschau der Erfolgsrechnung
Sie sehen, was die Kosten und Erlöse sind und ob es einen Gewinn oder Verlust geben wird. - Detaillierte Kontoauszüge
Mit dem Kontoauszug können Sie jeden Posten detailliert analysieren, um zu wissen, wie sich das Bankkonto oder die Liquidität entwickelt. - Mehrjahresprognosen
Sie können die Bilanz und die Erfolgsrechnung für 1, 2, 5 oder sogar 10 Jahre erstellen lassen.
Das Programm projiziert automatisch die Daten des Jahres für die folgenden Jahre. - Daten für Monate, Quartale und Jahre anzeigen
Sie können die Bilanz und die Erfolgsrechnung für einen Monat, ein Quartal, ein Semester, ein Jahr oder mehrere Jahre haben.
So können Sie den Zeitraum, für den Sie sich interessieren, im Detail analysieren. - Vergleichen Sie das Budget mit den Ist-Zahlen
Mit dem gleichen Kontenplan ist der Vergleich zwischen Budget und Ist-Zahlen unmittelbar möglich. Abweichungen vom Budget können Sie auf diese Art leicht erkennen. - Kosten- und Profitcenter und Segmente
Sie können auch bei der Erstellung Ihrer Budgets Kosten- und Profitstellen und Segmente verwenden.
Sie können detaillierte Budgets für einzelne Projekte, Kunden oder geografische Gebiete erhalten. - Speichern der Berichtseinstellungen (Kompositionen)
Erstellen Sie Berichte und speichern Sie Kompositionen, die Sie jederzeit wieder aufrufen können.

Erweiterte Planungsfunktionen
- Verwenden Sie in den Budgetbuchungen Mengen (Spalten 'Anzahl' und 'Einheit') und Preise (Spalte 'Preis/Einheit').
- Verwenden Sie Formeln, um Zinsen, Abschreibungen und Steuern automatisch zu berechnen.
- Erstellen Sie Ihre eigenen Berechnungsfunktionen in Javascript.
Beispiele für verfügbare Berichte
Planung mit monatlicher Unterteilung

Finanzplan für 4 Jahre mit jährlicher Unterteilung

Kontoauszug mit Details der zukünftigen Bewegungen
Der Kontoauszug ermöglicht detailliert zu Überprüfung, welche Elemente die Liquidität beeinflussen.
Doppelklicken Sie im Kontoauszug auf die Zeilennummer, um zur Budgetbuchungszeile der Tabelle Budget zurückzukehren und dort gegebenenfalls Änderungen vorzunehmen.

Eine Finanzprognose von null an erstellen
Sie können auf einfache Weise Finanzprognosen mit Liquiditätsplänen, Bilanz und Gewinn- und Verlustrechnung erstellen.
Die Prozedur ist die gleiche wie beim Erstellen der Buchhaltung.
1. Die Buchhaltungs-/Prognose-Datei
Mit Befehl Datei → Neu erstellen Sie eine Datei für die Finanzprognose, wobei Sie die Buchhaltungsart und die Vorlage verwenden, die Ihnen am besten zuspricht.
Sie können auch beginnen, indem Sie eine der gebrauchsfertigen zum Lernen vorbereiteten Vorlagen verwenden, die schon Beispiele mit Budgetbuchungen enthalten.
- Familienbudget (mit Cash Manager)
Ausgaben und Einnahmen Ihrer Familie planen - Finanzplanung beim Eröffnen eines Restaurants (Einnahmen-Ausgabenrechnung)
Diese Vorlage verwendet alphabetische Kontonummern, die das Verständnis erleichtern.
Mit der Einnahmen- und Ausgabenrechnung erstellen Sie auch ohne Buchhaltungskenntnisse eine professionelle Planung,mit Liquiditätsplan, Vermögensprognosen, Aufwand und Ertrag. - Finanzplanung beim Eröffnen eines Restaurants (Doppelte Buchführung)
Für vollständige Finanzprognosen, mit dem System der doppelten Buchführung, Für diejenigen gedacht, die mit der Methode der doppelten Buchführung vertraut sind.
Dieses Modell verwendet alphabetische Kontonummern, die das Verständnis erleichtern.
Es gibt auch Beispieldateien für komplexere Funktionen:
- Doppelte Buchführung mit Spalten Quantität und Formeln
Die verschiedenen Möglichkeiten zur Verwendung der Spalte Formeln werden aufgelistet. Mit Beispielen und Erklärungen. - Buchführung mit Fremdwährungen mit Beispielen von Budgetbuchungen mit Formeln
Wenn Sie die Formeln für die Fremdwährungs-Buchhaltung benutzen wollen - Mit Beispielen von komplexeren Buchungen
Nach der Erstellung können Sie die Datei speichern und ihr einen Namen geben, der sich vorzugsweise aus dem Firmennamen und der Jahreszahl "Firma-2020.ac2" zusammensetzt,
2. Die Datei personalisieren
Nachdem Sie die Datei erstellt haben, passen Sie sie an Ihre spezifischen Bedürfnisse an:
- Dateieigenschaften einrichten
- Name der Firma
- Buchhaltungsperiode
Normalerweise ist es das dem Kalenderjahr entsprechende Jahr. Sie können jedoch bei Bedarf ein anderes angeben. Sehen Sie diesbezüglich Periode der Finanzprognose.
- Den Kontenplan personalisieren
Sie können die Beschreibung bearbeiten, Konten oder Gruppen hinzufügen oder löschen.
Bei Bedarf können Sie den Kontenplan später jederzeit anpassen. - Wenn es sich um eine schon bestehende Aktivität handelt, fügen Sie die Eröffnungssaldi hinzu
3. Die Bewegungen der Finanzprognose eingeben
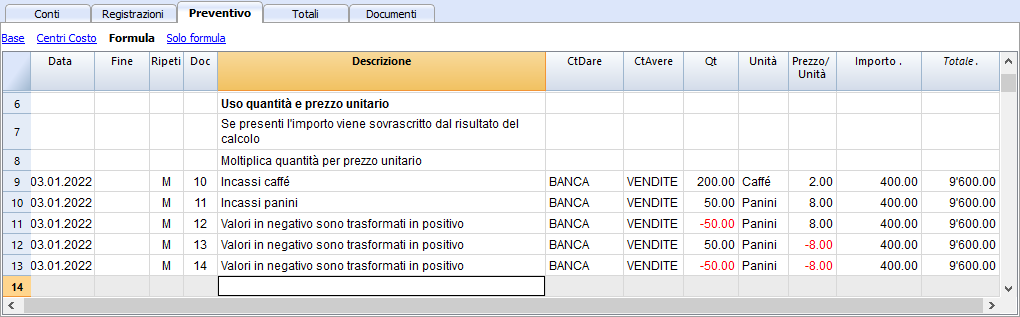
In der Tabelle Budget können Sie jetzt die Bewegungen bezüglich der Finanzprognosen eingeben
4. Prognose anzeigen
Die Prognosedaten sind sichtbar:
- In der grafischen Darstellung
- In der Tabelle Konten, Spalte Budget
- In den Berichten, in der Spalte Budget
- Im Kontoauszug, Budgetwerte
Prognose personalisieren
Sie können Bewegungen nach Belieben ändern, hinzufügen oder löschen. Die Prognose wird sofort neu berechnet.
Finanzplanung beginnen
Banana Buchhaltung ist die einzige Software auf der ganzen Welt mit integrierter Finanzplanung, die sich auf der Buchhaltungsmethode basiert.
Die gleiche Buchhaltungsdatei ermöglicht es Ihnen, Konten zu führen und/oder Finanzplanungen zu erstellen.
Sie können eine Datei haben, in der Sie nur die Buchhaltung verwalten, oder auch nur die Finanzplanung oder beides zusammen erledigen.
Durch das Zusammenfügen von Buchhaltung und Finanzplanung werden sie leistungsfähiger und Sie erhalten einen Überblick von der Vergangenheit, Gegenwart und Zukunft.
Finanzplanung in einer bestehenden Buchhaltungsdatei hinzufügen
Wenn Sie bereits eine Buchhaltungsdatei haben und diese auch für die Verwaltung der Finanzplanung benutzen wollen, müssen Sie die Tabelle 'Budget' hinzufügen.
Auf gleicher Art und Weise vorgehen, wenn Sie die Buchhaltung und die Finanzplanung zusammen verwalten wollen (zuerst die Buchhaltungsdatei erstellen und dann die Tabelle 'Budget' hinzufügen).
Eine separate Finanzplanung erstellen
In diesem Fall wird eine neue Datei erstellt, die für die Finanzplanung verwendet wird. Zum Beispiel, wenn Sie die Finanzplanung eines Startups von Null auf herstellen oder eines Startups, dessen Buchhaltung extern oder mit einem anderen Programm verwaltet wird.
Dokumentation mit Beispieldateien (Basis)
Auf den folgenden Seiten wird erläutert, wie Sie eine Finanzplanung erstellen. Sie verfügen über Beispieldateien, die heruntergeladen und in der Praxis angewendet werden können.
Die Beispieldateien wurden als Tutorials eingerichtet. Es werden alphabetische Konten verwendet, um das Verständnis der verschiedenen Buchführungskonzepte zu erleichtern.
Falls Sie einen Kontenplan mit einer bestimmten Struktur benötigen, können Sie entweder die bestehende Datei überarbeiten oder eine andere Vorlage verwenden und dann die Tabelle 'Budget' hinzufügen, um die Daten der Finanzplanung einzugeben.
- Finanzplanung für Familie (mit Cash Manager)
Um die Ausgaben und die Einnahmen Ihrer Haushaltskonten zu planen. - Finanzplanung für die Eröffnung einer Bar mit Restaurant (mit Einnahmen-Ausgaben-Rechnung)
Auch ohne Buchhaltungskenntnisse, können Sie aufgrund Ihrer Einnahmen und Ausgaben eine professionelle Finanzplanung erstellen. - Finanzplanung für die Eröffnung einer Bar mit Restaurant (mit Doppelter Buchhaltung)
Für diejenigen, die die Methode der doppelten Buchhaltung kennen.
Dokumentation mit Beispieldateien (mit fortgeschrittene Funktionen)
Die hier aufgeführten Erklärungen und zugehörigen Beispieldateien dienen dazu, fortgeschrittene Funktionen zu erlernen, wie z.B. die Mengen und Formeln.
- Doppelte Buchhaltung mit den Spalten 'Anzahl' und 'Formeln'
Es werden die verschiedenen Anwendungsmöglichkeiten der Spalte 'Formeln' aufgelistet (mit Beispielen und Erklärungen). - Doppelte Buchhaltung mit Fremdwährungen mit Budgetbuchungen mit Formeln
Für die Verwendung der spezifischen Formeln in Fremdwährung. - Mit Buchungsbeispielen zu komplexeren Themen.
Tabelle Budget
Bewegungen der Finanzprognose einfügen
Die Finanzplanung wird in Form von Budgetbuchungen in der Budget-Tabelle eingegeben. Die Buchungssätze werden gleich gemacht, wie normale Buchungen, beziehen sich jedoch auf die Zukunft.
Die Verwendung der Buchhaltungssprache für die Erstellung der Planung (für die Buchungen) hat den Vorteil, dass Herkunftskonto sowie Zielkonto der Beträge angegeben werden können. Dies erlaubt, sowohl die Gewinn- und Verlustrechnung wie auch die Bilanz und damit die Liquidität zu schätzen.
Für jeden erwarteten Geschäftsvorfall wird folgendes erfasst:
- Das Datum, an dem der Geschäftsvorfall voraussichtlich eintritt
- Bei sich wiederholenden Geschäfsvorfällen, den entsprechenden Wiederholungscode
- Eine beliebige Beschreibung
- Die Konten, welche von dem Geschäftsvorfall betroffen sind
- Den Betrag des Geschäftsvorfalls oder
- Anzahl und Preis
- oder die Formel für die Berechnung.
Die verschiedenen Arten von Budget-Bewegungen
- Statische Bewegungen mit fixen Datum und Beträgen. Diese sind ähnlich wie buchhalterischen Bewegungen.
- Diejenigen mit festen Beträgen.
- Es werden Menge und Preis pro Einheit eingegeben. Das Programm berechnet den Betrag sofort nach Erfassung von Anzahl und Preis pro Einheit.
- Wiederkehrende Bewegungen:
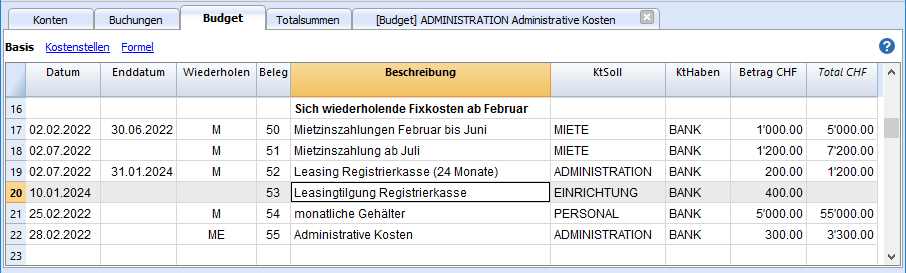
Für Vorfälle (wie z.B. Miete, Gehalt, Leasing), welche sich regelmässig wiederholen.- Der Zeitpunkt wird mit dem Datum des ersten Geschäftsvorfalls und eventuell mit Enddatum erfasst.
- Es wird der Wiederholungscode angegeben (täglich, wöchentlich, monatlich, vierteljährlich, halbjährlich, jährlich).
- Bewegungen mit Formeln:
Für die Berechnung von Zinsen, Abschreibungen, fälligen Steuern, Anschaffungskosten auf Margenbasis.- Der Buchungsbetrag wird vom Programm nach der eingegebenen Berechnungsformel berechnet.
- Die Formel wird bei Erstellung der Prognose aufgelöst.
- Bewegungen mit Formeln und Bewegungen:
Die Berechnung der Zinsen wird einmal geplant und hierauf vom Programm vierteljährlich oder wie angegeben wiederholt.- Es werden die gewünschte Wiederholung sowie die Formel eingegeben.
- Das Programm erzeugt die Wiederholungszeilen mit den Formeln.
- Es führt die Formeln der Zeilen in aufsteigender Reihenfolge des Datums aus; zuerst diejenigen mit niedrigstem Datum und danach aufsteigend diejenigen mit höherem Datum.
Die Wiederholung
Um anzuzeigen, dass die budgetierte Geschäftsvorfall sich wiederholt, werden die folgenden Spalten verwendet:
- Wiederholen
Wird ein 'M' = Monatlich (Month) eingetragen, ist es, als hätten Sie die Buchung bereits für alle folgenden Monaten eingegeben.
Wenn kein Wiederholungscode eingegeben wird, wird der Vorgang nur einmal ausgeführt. - Enddatum (Datum)
Wird zusammen mit der Wiederholung verwendet und gibt das letzte Datum an, an dem der Vorgang wiederholt wird. - Total (Totalsumme)
Der im laufenden Jahr erfasste Gesamtbetrag.
Es kann somit angegeben werden, dass sich bzw. mit welcher Frequenz sich eine Budgetbewegung sich wiederholt. Die Geschäftsvorfall bzw. die Bewegung wird also nur einmal eingegeben und das Programm erzeugt hierauf automatisch alle ihr folgenden Budgetbuchungen.
Die Wiederholung ist der zentrale Punkt der Planung in Banana Buchhaltung und ist aus den folgend aufgeführten Gründen nützlich:
- Schnelle Planung:
- Wiederkehrende Bewegungen wie Miete, Bankgebühren, Gehälter und mehr können mit einer einzelnen Buchungszeile erfasst werden.
- Der Benutzer gibt den Buchungssatz beim ersten Mal an und diese wird danach vom Programm automatisch wiederholt.
- Bei notwendigen Anpassungen ist nur eine Zeile zu bearbeiten und die Planung wird hierauf umgehend aktualisiert.
- Bei Formeln wird der Betrag für jedes einzelne Datum separat berechnet.
- Komplexe Berechnungen können mit einer einzelnen Budgetbuchungszeile vollständig automatisiert werden.
- Es können progressive Fortschritte geplant werden (z.B. Steigerung des Jahresumsatzes).
- Das Programm ist in der Lage, Finanzprognosen für mehrere Jahre zu erstellen:
- Zum Zeitpunkt der Erstellung des Berichtes wird die gewünschte Wiederholungsperiode angegeben.
- Das Programm wiederholt automatisch alle Zeilen, für welche eine Wiederholung angegeben wurde bis zum Enddatum des Wiederholungszeitraumes oder dem für die Zeile angegebene Enddatum, falls dieses kleiner ist.
- Um über Prognosen über mehrere Jahre verfügen zu können, muss bei der Erstellung eines Jahresplans für Vorfälle, welche auch in den Folgejahren erwartet werden, die Wiederholung "Y" (Year) anzugeben.
Betrag-Spalte
Für Planungszwecke wird der Wert der Spalte Betrag benutzt, welcher:
- manuell erfasst werden kann
- das Resultat einer Berechnung sein kann:
- Wenn eine Menge und ein Preis erfasst werden, ergibt sich der Betrag aus der Multiplikation dieser Werte.
Wenn hingegen nur die Anzahl oder der Preis erfasst wurden, resultiert der Betrag 0. - Wenn eine Formel eingegeben wird, ist der Betrag das Resultat der Formel.
Die Formel hat auch Vorrang vor Menge und Preis. Bei Vorhandensein einer Formel wird der Inhalt der Spalten Anzahl und Preis/Einheit nicht berücksichtigt.
- Wenn eine Menge und ein Preis erfasst werden, ergibt sich der Betrag aus der Multiplikation dieser Werte.
Prognosen mit Mengen und Preisen
Wenn eine Menge und ein Stückpreis eingegeben werden, berechnet das Programm automatisch den Betrag der Buchung.
Für ein Restaurant können z.B. die servierten Speisen und die durchschnittlichen Kosten angegeben werden.
Dadurch erhalten Sie eine genauere Vorstellung von den Elementen, aus denen sich die Planung zusammensetzt. Ändert man den Preis, können die Auswirkungen einer Preisänderung simuliert werden.
Berechnungsformeln
In der Spalte Formel kann eine Formel in der Javascript-Sprache eingegeben werden.
Es können Berechnungen eingegeben, Variablen zugewiesen und benutzt werden sowie Funktionen aufgerufen werden.
Es gibt Funktionen, die es ermöglichen, die Daten der Planung bis zu diesem Zeitpunkt zu benutzen.
Anwendungsbeispiele:
- Abschreibungen berechnen:
Wird der Wert der Investitionen geändert, ändert sich auch die Abschreibung. - Zinsen berechnen:
Die Verzinsung erfolgt auf Basis der tatsächlichen Nutzung (365/365 Tage). - Provisionen berechnen:
Geben Sie einen Prozentsatz ein, mit welchem der den Verkäufern zu bezahlende Betrag, auf der Basis der Einnahmen eines bestimmten Zeitraums berechnet wird.
Mit den Formeln können die verschiedenen Verpflichtungen automatisiert werden. Höhere Erträge werden zu höheren Provisionen und niedrigeren Zinssätzen führen. Geringere Investitionen führen automatisch zu geringeren Abschreibungen und Zinsen.
Total-Spalte
Bei normalen Budget-Buchungszeilen entspricht dieser dem Betrag.
Bei Wiederholungen ist es die Summe der Beträge alle wiederholten Budget-Buchungszeilen, welche in die unter Menü Datei, Eigenschaften (Stammdaten) definierte Buchhaltungsperiode fallen.
Tabelle Budget hinzufügen oder entfernen
Die Finanzplanung erfolgt in Form von Buchungen in der Tabelle Budget.
Wenn Ihre Datei noch nicht über die Budget-Tabelle verfügt, wie folgt vorgehen:
- Vom Menü Werkzeuge ausgehen
- Befehl Neue Funktionen hinzufügen auswählen
- Im Dialogfenster, das sich öffnet, die Option Tabelle Budget hinzufügen auswählen.
(Steht diese Option nicht zur Verfügung, bedeutet dies, dass die Tabelle Budget bereits hinzugefügt worden ist).
Achtung: Diese Operation kann nicht mittels Befehl 'Rückgängig' (Menü Bearbeiten) gelöscht werden! Wenn Sie zur vorherigen Situation zurückkehren wollen, behalten Sie eine Kopie der vorhandenen Datei oder führen Sie aus Menü Werkzeuge die Option Tabelle Budget entfernen aus.
Das Programm...
- fügt die Tabelle Budget hinzu und übernimmt die Werte des Budgets, die in der Tabelle Konten stehen (falls vorhanden).
- sperrt die Spalte Budget in der Tabelle Konten. Die Werte dieser Spalte werden aufgrund der Budget-Buchungen berechnet, wobei die Buchhaltungsperiode die ist, die in den Eigenschaften (Stammdaten), Menü Datei, definiert worden ist.
Tabelle Budget entfernen
Die Tabelle Budget kann mittels Befehl Neue Funktionen hinzufügen aus Menü Werkzeuge rückgängig gemacht werden. Im Dialogfenster 'Wert auswählen' ist hierzu die Option Tabelle Budget entfernen auszuwählen und die Schaltfläche 'OK' zu betätigen.
Hinweis: Diese Operation kann nicht rückgängig gemacht werden, wenn bereits Budget-Buchungen vorgenommen worden sind! Sobald der Befehl Tabelle Budget entfernen erteilt wird, werden alle Budgetbuchungen gelöscht. Wenn Sie zur vorherigen Situation zurückkehren wollen, sollten Sie eine Kopie der Daten erstellen.
Nach Entfernung der Budget-Tabelle, kann die Spalte Budget in der Tabelle Konten wieder bearbeitet werden.
Spalten der Tabelle Budget
Die Spalten der Tabelle Budget sind ähnlich, wie diejenigen der Tabelle Buchungen. Im folgenden Beispiel, wurden zum besseren Verständnis, alphanumerische Kontenbezeichnungen verwendet. Wird über einen Kontenplan mit numerischen Kontennummern verfügt, werden natürlich die entsprechenden eigenen Kontennummern verwendet.

In der Regel benutzt man zum Eingeben des Budgets die Spalte Betrag.
Für umfangreichere Finanzplanungen besteht auch die Möglichkeit, die Menge, die Einheitspreise oder eine Formel anzugeben. Das Programm wird automatisch den Wert der Spalte Betrag berechnen.
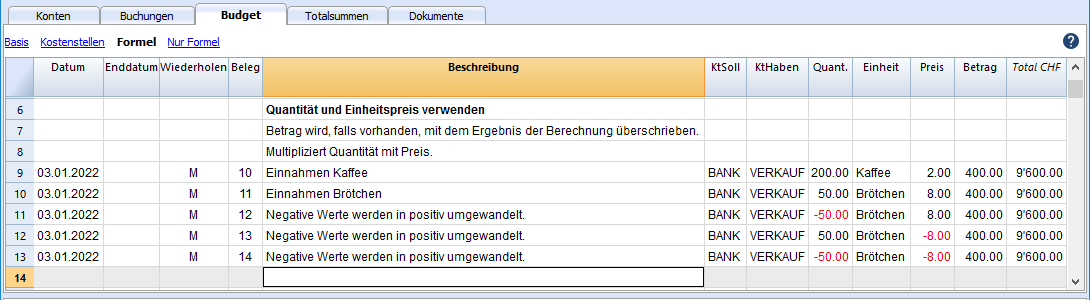
Die Spalten der Budget-Tabelle werden folgend erläutert:
- Datum
Das voraussichtliche Datum, an dem die Transaktion stattfinden wird.
Falls das Datum noch nicht genau bestimmt werden kann, z.Bsp. monatliches Verkaufsbudget, das Monatsende als Datum eingeben. - Enddatum
Das Feld leer lassen oder das Datum erfassen, nach dem es keine Wiederholung mehr gibt. - Wiederholen
Es wird ein Wiederholungscode eingegeben, dem eventuell eine Zahl vorangestellt wird:
(3M vierteljährlich, 6M halbjährlich, 7D wöchentlich, 3ME vieteljährlich Ende Monat)- Leer entspricht keiner Wiederholung
- "D" für tägliche Wiederholung (Day)
- "W" für wöchentliche Wiederholung (Week)
- "M" für monatliche Wiederholung (Month)
- "ME" monatliche Wiederholung, aber mit Datum am Ende des Monats.
Wenn mit 28.2.2017 begonnen wird, dann ist das nächste Datum der 31.3.2017. - "Y" für jährliche Wiederholung (Year)
- "YE" jedes Jahr, aber Ende Monat.
Bei Datum 28.2.2015 wird das nächste Datum 29.2.2016 lauten.
- Variante
Diese Spalte wird benötigt, um in Kombination mit den Apps eine eventuelle Variation bezüglich Budget anzugeben. - Neues Jahr
Hier wird angeben, was übertragen wird, wenn man Befehl Neues Jahr erstellen... (siehe hierzu Abschluss und Neues Jahr) auswählt- Kein Wert: das Datum wird um ein Jahr erhöht
- "1": Das Datum bleibt gleich
- "2": Die Operation wird nicht ins Neue Jahr übertragen werden.
- KontoSoll und KontoHaben, KS1, KS2, KS3
Wie in der Buchungen-Tabelle werden in diesen Spalten die Konten erfasst, auf denen die Transaktionen gebucht werden sollen.
Es können auch Segmente sowie Kosten- und Profitstellen verwendet werden. Auf diese Weise kann auch ein Budget für Segmente oder Kosten- und Profitstellen erstellt werden. - Anzahl
Die Anzahl multipliziert mit dem Einheitspreis ergibt die Totalsumme. - Einheit (Referezeinheit)
Mengenbezogene Beschreibung der Anzahl, wie zum Beispiel m2, t oder Stk. - Preis/Einheit (Einheitspreis)
Der Preis für jede Einheit multipliziert mit der Anzahl (Menge) ergibt die Totalsumme.- In der Einnahmen-Ausgaben-Rechnung ist ein negativer Betrag zu erfassen, damit der Betrag in der Spalte 'Ausgaben' eingefügt wird.
- Betrag (in Basiswährung)
Betrag, der zu buchen ist.
Wenn die Zeile eine Wiederholung vorsieht, wird der Betrag der ersten Budgetbuchung angegeben. Die Beträge der hierauf folgenden Wiederholungen sind im Kontoauszug (Budgetbuchungen) ersichtlich.
In den folgenden Fällen wird der Betrag automatisch berechnet:- Wird in der Spalte Anzahl oder Preis/Einheit (Einheitspreis) ein Wert eingegeben, wird der Betrag aufgrund des Inhalts dieser zwei Spalten berechnet.
- In der Doppelten Buchhaltung wird das Resultat in einen positiven Wert umgewandelt.
- In der Einnahmen-Ausgaben-Rechnung wird ein positives Resultat als Einnahme und ein negative Resultat als Ausgabe berücksichtigt.
- Wird eine Formel eingegeben, ist der Betrag das Resultat der Formel.
Die Formel hat auch gegenüber Anzahl und Einheit/Preis Vorrang.
- Wird in der Spalte Anzahl oder Preis/Einheit (Einheitspreis) ein Wert eingegeben, wird der Betrag aufgrund des Inhalts dieser zwei Spalten berechnet.
- Total (Totalsumme in Basiswährung)
Es handelt sich um die Totalsumme der Zeilen, die sich in dieser Buchhaltungsperiode wiederholen.
Um die einzelnen Beträge sehen zu könnnen, den Befehl Kontoauszüge (Budgetbuchungen) aus Menü Buch1 ausführen. - Formel (Formel Betrag in Basiswährung)
Erlaubt das Einfügen von Berechnungsformeln in der Javascript-Sprache sowie von Banana Apps-Programmationsfunktionen.
Wenn eine Formel (oder irgendein Text) vorhanden ist, wird der Wert der Spalte 'Betrag' entsprechend des Resultats der Formel eingefügt.
Siehe auch den Abschnitt unten für die Verwendung.- In der Doppelten Buchhaltung muss das Resultat der Formel immer einer positiven Zahl entsprechen.
- In der Einnahmen-Ausgaben-Rechnung wird das Resultat falls positiv als Einnahme und falls negativ als Ausgabe betrachtet.
- Betrag Währung (Betrag in Kontowährung)
Betrag in Kontowährung der Buchung (siehe Buchungen mit Fremdwährungen).
Dieser Betrag wird für die Berechnung des Wertes in Basiswährung zum angegebenen Wechselkurs verwendet.
Wenn eine Formel vorhanden ist, entspricht der Wert dem Resultat der Formel.
Wenn die Zeile eine Wiederholung vorsieht, wird der Betrag der ersten Budgetbuchung angegeben. - Formel Betrag in Währung (in Kontowährung)
Hier kann eine Berechnungsformel angegeben werden.
Wenn die Zeile eine Wiederholung vorsieht, wird der Betrag der ersten Buchung angegeben. Um die Beträge der folgenden Buchungen sehen zu können, den Befehl Kontoauszüge (Budgetbuchungen) aus Menü Buch1 ausführen. - Total (Totalsumme in Kontowährung)
Es handelt sich um die Summe der Beträge in der Kontowährung der wiederholten Zeilen, deren Datum innerhalb der in den Eigenschaften (Stammdaten) definierten Buchhaltungsperiode liegen. Wenn es kein Datum gibt oder wenn Start- und Enddatum ausserhalb der Buchhaltungsperiode liegen, bleibt die Spalte leer.
Finanzplanung mit der Tabelle Budget
Wenn Sie in Ihrer Buchhaltung die Tabelle 'Budget' hinzufügen, können Sie eine vollständige und professionelle Finanzplanung erstellen.
Integrierte Budget und Finanzplanung, die sich auf der Buchhaltungsmethode basieren
Mit Banana Buchhaltung erfolgt die Planung viel einfacher und schneller, da sie innerhalb des Buchhaltungsprogramms durchgeführt wird.
Alles ist bereits voreingerichtet und innert kürzester Zeit können Sie auf einfachste Art eine voraussichtliche Bilanz und Erfolgsrechnung sowie den Liquiditätsplan erhalten.
So vorgehen:
- Eine neue Buchhaltungsdatei für die Finanzplanung erstellen.
- Die Buchhaltungsdatei personalisieren, wie folgt:
- die Stammdaten und gewünschte Zeitperiode eingeben.
- den Kontenplan den persönlichen Bedürfnissen anpassen.
- Bewegungen der Finanzprognose einfügen.
Lernen nach einem bestehenden Beispiel
Bitte befolgen Sie dazu die Anleitung unserer Webseite Finanzplanung beginnen.
Periode der Finanzprognose
Das auf der Methode der doppelten Buchhaltung basierende System ermöglicht es Ihnen, Prognosen zu erstellen, wobei Sie angeben, wann die Operation stattfinden wird.
Im Gegensatz zu Excel, wo Sie das Blatt mit den Spalten für die Prognoseperioden (Monat, Quartal oder Jahr) festlegen, gibt man in Banana Buchhaltung einfach das Datum des erwarteten Ereignisses an. Die Zuordnung zu einer Periode erfolgt automatisch durch das Programm bei der Präsentation der Daten. Sie können wählen, ob Sie Prognosen für einen Tag, eine Woche, einen Monat, 2 Monate, ein Quartal, ein Semester, ein Jahr, 2, 5 oder 10 Jahre anzeigen möchten.
- Sie können Prognosen für ein oder mehrere Jahre erstellen
- Auf Basis der im Programm eingeführten Daten, berechnet es die Prognosen der Liquidität, der Bilanz und der Erfolgsrechnung für den betreffenden Zeitraum
- Sie können sowohl tägliche Prognosen, die besonders für die Liquidität nützlich sind, aber auch Prognosen für Monate oder Jahre erstellen.
Sehen Sie Ausdrucke und Berichte der Finanzprognosen
Buchhaltungsperiode für Planung und Prognosen
Buchhaltung oder Prognosen beziehen sich immer auf eine Periode. Die folgenden Perioden werden unterschieden:
- Buchhaltungsperiode
Es handelt sich um die in den Dateieigenschaften definierte Periode mit Anfangs- und Enddatum.
Im Allgemeinen entspricht sie dem Kalenderjahr, aber sie kann ein beliebiges Anfangs- und Enddatum haben. - Planungsperiode
Dies ist der Zeitraum, für den die Budgetdaten eingegeben werden.- Das Programm verlangt nicht, eine Planungsperiode festzulegen.
- Es wird im Allgemeinen angenommen, dass sie der Buchführungsperiode entspricht.
- Die Planungsperiode kann von der Buchführungsperiode abweichen.
Die Budgettabelle enthält Zeilen, die über die Buchführungsperiode hinaus wirksam sind.- Transaktionen mit Daten ausserhalb der Buchführungsperiode.
- Sich wiederholende Transaktionen ohne Enddatum oder mit einem Enddatum, das über das Datum der Buchführungsperiode hinausgeht.
- Prognoseperiode
Das Programm benützt diese Periode um die Prognose zu berechnen.- Sie wird bei der Erstellung eines Ausdrucks angegeben.
- Verwendet standardmässig die Buchhaltungsperiode.
- Sie kann frei eingestellt werden und auf diese Weise können Prognosen für mehrere Jahre und sogar für mehrere Jahrzehnte erstellt werden.
- Die Buchhaltungsperiode wird als Prognoseperiode für die Berechnung des Inhalts der Spalte "Total" in der Tabelle Budget und der Spalte Budget der Tabellen Konten und Kategorien.
- Diese Werte beziehen sich daher auf den in den Eigenschaften Stammdaten definierten Abrechnungszeitraum.
- Falls das Anfangs- und Enddatum geändert werden, werden die Prognosen neu berechnet.
- Sie wird bei der Erstellung eines Ausdrucks angegeben.
Prognosen mit monatlicher Logik
In der Budgettabelle geben Sie die prognostizierten Bewegungen ein und geben das Datum an, an dem sie voraussichtlich eintreten werden. Möglichst genaue Daten der Einnahmen und Ausgaben sind für die Liquiditätsprognose wichtig.
Für alle anderen Einnahmen und Ausgaben, die an einem Tag des Monats bzw. am Anfang oder Ende des Monats anfallen, wie z.B. Miete, Löhne, Bankgebühren und andere Ausgaben oder Einnahmen, ist es wichtig, den Tag anzugeben, der dem tatsächlichen Zahlungstag am nächsten liegt.
Zum Beispiel ist es, abgesehen von Sonderfällen, für die Erträge eines Restaurants, nicht angebracht, Tag für Tag Vorhersagen zu treffen. In diesen Fällen reicht es, den Gesamtumsatz anzugeben, der für den Monat erwartet wird. In diesem Fall ist es ratsam, den 15. Tag, nämlich Mitte Monat anzugeben.
Prognose für das laufende Jahr
In der Tabelle Budget geben Sie die Bewegungen mit oder ohne Wiederholung ein.
Die Berechnung der Prognose erfolgt im Allgemeinen unter Berücksichtigung der Bewegungen innerhalb der aktuellen Periode, die in den Dateieigenschaften definiert sind.
- Die Spalte Totalsumme in der Tabelle Budget zeigt den Gesamtbetrag für die aktuelle Periode.
- Die Spalte Budget in der Tabelle Konten und Kategorien zeigt den prognostizierten Saldo für die aktuelle Periode.
- Wenn Sie in den verschiedenen Ausdrucken als Zeitraum Alles angeben, haben Sie Prognosen für den aktuellen Zeitraum.
Wenn die Datei auch zur Führung der Buchhaltung verwendet wird, muss natürlich die Abrechnungsperiode die der Buchführung sein. Selbst wenn die Datei nur für Prognosen verwendet wird, ist es besser, die Abrechnungsperiode auf nur ein Jahr festzulegen. Wenn Sie in den Stammdaten einen Zeitraum von zwei Jahren eingeben, werden die Werte der Prognosen in der Spalte Totalsumme und Konten für die beiden Jahre angegeben. Dies kann zu verwirrenden Werten führen.

Prognosen für mehrere Jahre
Wenn Sie prognostizierte Bewegungen mit dem Wiederholungscode eingeben, ist das Programm in der Lage, Prognosen über den definierten Zeitraum hinaus zu erstellen.
Um Prognosen über mehrere Jahre zu erhalten, geben Sie die Bewegungen in die Tabelle Budget ein.
- Eröffnungssaldi
- Werden in der Tabelle Konten eingegeben
- Prognostizierte Bewegungen vor der Rechnungsführungsperiode.
- Für besondere Fälle ist es auch möglich, Transaktionen mit Datum vor der Buchhaltungsperiode einzugeben.
- Vorsicht ist geboten, da diese Operationen die Saldi zum Zeitpunkt der Eröffnung verändern werden.
- Bei diesen Vorgängen ist die Spalte Totalsumme leer, da sie ausserhalb der Buchhaltungsperiode liegt.
- Prognostizierte Bewegungen für die Buchhaltungsperiode.
- Die Bewegungen werden mit dem Datum angezeigt, das in die Buchhaltungsperiode fällt.
- Wenn es Vorgänge gibt, die in den folgenden Jahren wiederholt werden, müssen Sie den jährlichen Wiederholungscode "Y" einrichten.
- wenn die Operation über mehrere Jahre wiederholt wird, geben Sie die Anzahl der Jahre vor dem Y an, also für jeweils 2 Jahre "2Y", 5 Jahre "5Y", 10 Jahre "10Y".
- Wenn die Wiederholung nicht über ein bestimmtes Datum hinausgeht (z.B. Zahlung eines Mietvertrags), ist das Enddatum anzugeben.
- Prognostizierte Bewegungen für die folgenden Jahre.
- Man nennt das zukünftige Datum, an dem die Transaktion voraussichtlich stattfinden wird.
- Sie können den Wiederholungscode und das Enddatum angeben.
-
Bei diesen Vorgängen ist die Spalte Totalsumme leer, da sie ausserhalb der Buchhaltungsperiode liegt.
Formeln benutzen
Die Formeln ermöglichen es, die Amortisations- und Zinsberechnungen zu automatisieren. Wenn eine Investition steigt, wird auch die Gewinn- und Verlustrechnung sofort aktualisiert. Die Formeln sind besonders nützlich, wenn Prognosen über mehrere Jahre erstellt werden.
Mit Hilfe der Formeln können Sie den Betrag der Wiederholungszeilen automatisch anpassen lassen.
- Die Berechnung der Amortisation kann auf dem Saldo des Kontos für Anlagevermögen basieren.
- Die Berechnung der Zinsen kann direkt bei der Bewegung des Bankkontos erfolgen.
- Sie können einen Verkaufsverlauf angeben.
-
Sie können Ihre Einkäufe als Prozentanteil definieren.
Ausdrucken mit der Prognoseperiode
Dank der Tatsache, dass Bewegungen mit dem Wiederholungscode oder mit den Daten der folgenden Jahre in die Tabelle Budget eingegeben wurden, ist das Programm in der Lage, die Prognosen für zukünftige Jahre zu berechnen.
Wenn Sie den Bericht ausdrucken, geben Sie das Anfangs- und Enddatum im Abschnitt Periode an.
Angenommen das Anfangsdatum ist der 1. Januar 2022:
- Wenn Sie eine 2-Jahres-Prognose wünschen, geben Sie bitte das Enddatum 31. Dezember 2024 an.
- Wenn Sie eine 5-Jahres-Prognose wünschen, geben Sie das Enddatum 31. Dezember 2027 an.
-
Wenn Sie eine 20-Jahres-Prognose wünschen, geben Sie das Enddatum 31. Dezember 2042 an.
Eine Prognose ist für die folgenden Ausdrucke verfügbar:
Alle Buchhaltungsberichte können Buchhaltungswerte, Prognosewerte oder beides zusammen enthalten. Die Parametrisierungsmöglichkeiten sind für Buchhaltungsberichte und Prognosen die gleichen.
Dank diesen Berichten bekommt man Prognosebilanzen, prognostizierte Erfolgsrechnungen, Liquiditätspläne, Investitionspläne, Finanzpläne und anderes für zukünftige Perioden.
Spalten nach Periode unterteilen
In der Sektion Unterteilung können Sie dem Programm angeben, Spalten zu erstellen für die Periode.
So können Sie die Entwicklung nach Monat, Vierteljahr oder Jahr feststellen.
Mit den Kompositionen können Sie Formate für den Ausdruck einstellen und später wieder abrufen. Wenn Sie Prognosen über mehrere Jahre machen, ist es sinnvoll, vordefinierte Kompositionen zu haben, gesamthafte, pro Jahr, 5 Jahre oder mit dem Vergleich zwischen Bilanz und Budget die Sie schnell abrufen können.
Bilanz - Drei-Jahres-Prognose
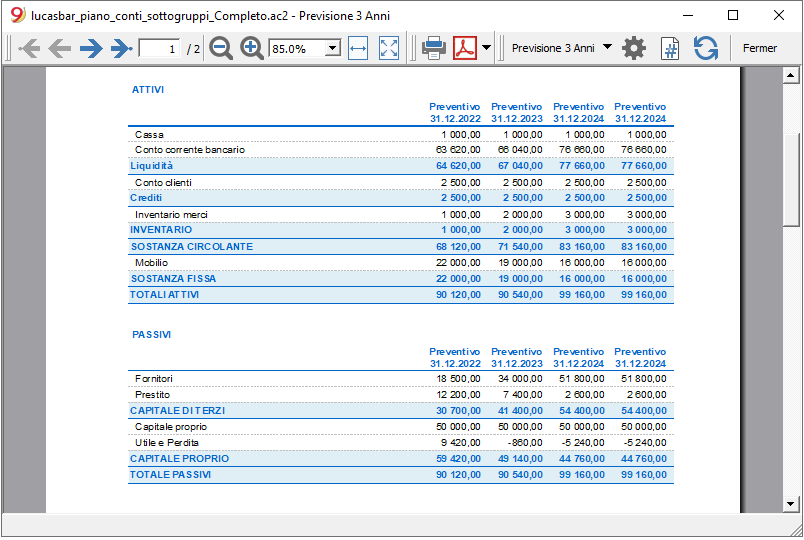
Erfolgsrechnung - Drei-Jahres-Prognose

Budget transactions
When preparing financial forecasts, based on the double-entry method, transactions are entered in the Budget table. Indicate origin and destination accounts for each one. The program has the information necessary to prepare Balance Sheets and Income statements, that will however relate to the future and not the past.
When one is planning with Excel, the Income statement is set up first, then the revenues and costs are listed. Generally, the liquidity and investment plan is prepared only later and on separate sheets.
When making forecasts with the double-entry method, we proceed instead as if we were keeping an accounting for the future. All the transactions that are expected to occur will be listed. The program will then automatically prepare the Balance Sheet and Profit and Loss account for the indicated period or periods.
Structuring of budget transactions
For the preparation of a financial plan, we generally proceed by listing the different elements in the following order:
- Capital injections.
- Third party capital injections.
- Setting up expenses.
- Investments.
In furniture, equipment. - Recurring fixed costs.
Rent, staff, social security charges, energy, subscriptions. - Recurring revenues.
- Variable revenues
The turnover which is typically seasonal. - Variable costs.
Commissions, costs of the goods sold and others, which are related to the expected volume of revenues. - Year-end transactions.
Depreciation, taxes, interest on loans, dividends.
By the time you enter sales and variable costs, you will already have the cost and capital structure. It will be possible to know instantly, whether the expected turnover will allow the company to generate sufficient profits and liquidity to guarantee its sustainability over time.
Amount and Formula column
As a rule, to prepare a budget, simply use the Amount column.
For more elaborate estimates, there is the possibility of indicating quantities, unit prices, or a formula. The program will automatically calculate the value in the Amount column.
Updating forecasts
With the double-entry method, thanks to the possibility of indicating each operation in detail, it becomes easier to update and improve the forecast. Initially, estimates of different costs or investments will be entered. As you get closer to the operational phase and there will be more precise data, just replace the existing ones. Even when the activity has started and exact elements are known, the forecast can be updated easily. Precise and reliable indications on profitability and liquidity are thus available.
Dates and repetitions in financial forecast transactions
The Data column
The value contained in the Data column is the one that will validate the forecast.
- If there is no date, the transaction will be taken into account at the beginning of the planning.
If you require a forecast indicating a period, the amounts will be taken into account in the balance value at the beginning of the period.
Due to the fact that it does not fall within the period, no amount will be displayed in the Total column. - Dates in the accounting period set in the file properties.
These are the ones commonly used. The total amount will be indicated in the Total column, taking into account repetitive movements, within the accounting period. - Dates prior to the period.
You can enter movements that precede the forecast period. However, you must be careful that they do not conflict with the opening balances entered in the account table.
Due to the fact that it is not within the period, no amount will be displayed in the Total column. - Dates after the period.
If you make forecasts over several years, they allow you to indicate transactions for the years to come.
Due to the fact that it is not within the period, no amount will be displayed in the Total column.
The End date
This is used in combination with repetition, to indicate the last date beyond which there is to be no repeat.
- Must generally be left empty.
If you enter a date when it is not necessary (for example the end of the accounting period) the forecasts for the following years will not include this operation. - For leasing transactions.
Indicate the date on which the payment of the last installment will be made as the end date. - For loan repayment.
Indicate the last expected payment date. - For changes in the amount at set deadlines.
In the case, for instance, that the amount of a recurring transaction is adapted at certain deadlines (salary increase).- Create a transaction row with repeat "M" and End date as per the last payment before the increase.
Create transaction rows with Data when the increase begins. - If the increase follows a precise and regular automation, this can also be programmed with formulas.
- Create a transaction row with repeat "M" and End date as per the last payment before the increase.
Repetitions
For recurring expenses or income, the repetition code is recommended (refer to Documentation on the columns).
- When calculating the forecast, the program creates copies of the operation and progressively increases the date, taking into account the indicated frequency.
- If there is no end date, the program will generate internal copies of the records for the entire period of the forecast indicated at the time of the report when calculating the forecast.
- If the start date is January, the frequency is monthly
- If the forecast period is the year, it will generate rows from February, 1 original row and 11 automatic rows, for a total of 12.
- If the forecast period is 10 years, it will generate rows starting from February, 1 original row and 119 automatic lines (11 the first year + 12 * 9 for the following ones), for a total of 120 lines.
- If the start date is January, the frequency is monthly
- If you want the program to automatically calculate forecasts for subsequent years.
- For recurring operations, indicate the relative repetition code.
- For transactions that occur only once a year (for example depreciation at the end of the year), indicate the repetition code "Y", so that the depreciation is also calculated in the following years.
- Don't use the repetition only if the operation will not occur in the following year.
Total column of the Budget table
The Total column is calculated automatically and represents the sum of the amounts of the current row and the repetition amounts that fall within the accounting period. The Total column is empty if the transactions have an earlier date or extend beyond the accounting period.
Schedule with precise date and monthly logic
Forecast movements are entered in the Budget table indicating the date on which these are expected to occur.
However, it is not always possible to predict all revenues and expenses with a daily precision. When making a forecast it is therefore useful, in some cases, to use approximations, generally reasoning on a monthly basis. In any case, it is useful to always follow a specific logic so that reliable liquidity forecasts can also be obtained in the short term:
- Punctual operations (capital payment, investments) are indicated with the date on which they are expected to occur.
If there is no precise date, it is useful to indicate them on the 15th day of the month in which they are expected to occur. - Recurring charges that have a precise payment date are to be set with the expected payment date and the relative repetition code:
- Bank charges, interest, amortization are to be indicated at the end of the month, quarter or year that they will take place.
- Rentals on the due expected date of payment.
- Salaries and social security charges
- For the calculation and monthly payment on the day that wages are paid.
- For thirteenths, bonuses or whatever at the moment they are paid.
- Payments for advances and adjustments of social security charges on the expected payment date.
- Payments and VAT adjustments on the typical payment due day.
- Revenue Forecasting.
The preparation of the forecasts depends on the type of activity.
If you do not know the exact day, but you will know that it will happen in a certain month, it is recommended to indicate the 15th of the month- Punctual revenue.
They are to be indicated on the date on which it is expected to take place or mid-month. - Recurring revenue.
To be indicated on the date of entry or mid-month. - In many cases a monthly forecast is well suited. The revenue can be indicated on the 15th of the month.
- If the revenues are recurring, the revenue can be entered with the monthly repetition. Using formulas you can predict growth.
- If there are seasonal differences, it is helpful to have a sales forecast row for each month.
- Forecast of projects or major works.
If there is a calendar with receipts, a transaction row is to be indicated for each expected entry. It can be approximated by indicating the 15th of the month. - Forecast for customers.
For a consultant or commercial advisor, who works both with budgets and projects, it can prove very useful to set up a detailed revenue forecast for each client, with the expected payment dates. This forecast will also be very useful to check if the customer has actually paid.
- Punctual revenue.
- Variable costs.
- Constant expenses linked to the turnover (a restaurant for example ), are indicated with the same date as the turnover. With a formula you can also calculate as a percentage value of the turnover.
- Costs can also be linked to other elements, such as the number of employees, rented premises or other.
Forecasting with the cash principle
Planning for small business and cash activities (such as shops, restaurants) it is useful to proceed with the cash principle, then indicate the revenues with the date on which they will be collected and the costs when paid.
For important operations, such as the purchase of a machine whose payment is deferred over time, it is however useful to insert forecast movements with precise details:
- Purchase of machinery (asset registration with suppliers) with date of purchase.
- Payment of the machinery, with the date(s) on which payment is expected.
Forecasts with the accrual method
In this case, the insertion of the operations takes into account when the payment will be made.
- Cash transactions.
They are obviously registered normally. - Transactions expected to be settled in the near future.
For simplicity, the operations that fall within the forecast month or the one immediately following, it can be useful to use the cash principle. - Deferred payments.
If the dates are not known with precision, you can use the 15th of the month.- Transactions with precise payment terms.
- One movement indicates the purchase date with the counterpart in the supplier account.
- One of the other movements indicates payment on the scheduled dates.
- Transactions with precise payment terms.
- Deferred collections.
- With precise payment terms, as is the case with a project:
- A movement indicates the billing date and the customer account with the counterpart.
- One of the other movements indicates payment on the scheduled dates.
- Late payment.
This is the case when a part of the revenues is collected in the short term, a percentage is collected later. It can be done like this:- Enter the revenue as cash collection.
- With the same date, a movement is created that moves a part of the collection to the customer account.
- At a later date, the cash collection is indicated with the client account of the counterpart.
- With precise payment terms, as is the case with a project:
- Use of variables for deferred collections and payments( see Example use of variables)
When the same value must be reused at the time of payment, it can prove very useful to use the formula column and variables.- In the billing transaction, the amount is assigned to a variable.
- In the payment movement, the variable is inserted so that the amount is automatically taken over.
- Variables can also be used to define the percentage of the amount that will be deferred, for example.
Esempi di movimenti di previsione finanziaria
I movimenti di pianificazione si inseriscono come delle normali registrazioni, con la data descrizione, importo, conto dare e avere.
In più si usa però il campo ripetizione, che consente di inserire le operazioni ricorrenti con una riga sola.
Qui di seguito sono elencati diversi esempi ripresi dal modello seguente a cui si rimanda per ulteriori spiegazioni.
Normali registrazioni di previsioni
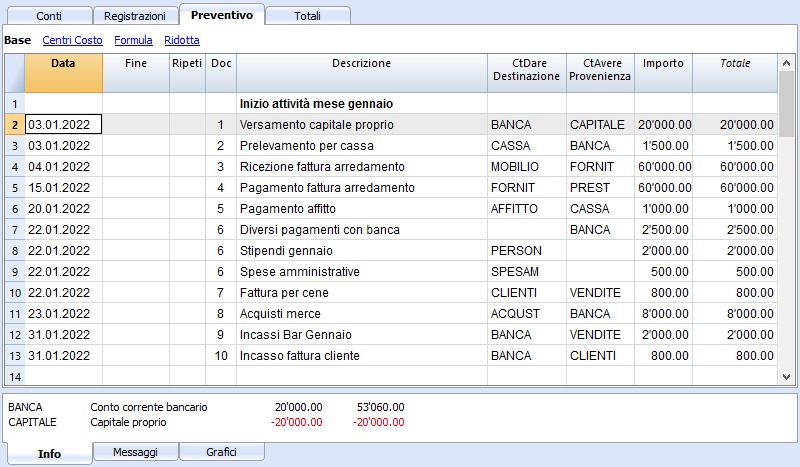
Si tratta di registrazioni di previsione che sono come delle normali registrazioni.
L'esempio qui indicato è riferita all'inizio dell'attività, quindi operazioni che non si ripetono.
Registrazioni ripetitive mensili
Qui di seguito degli esempi di registrazione con ripetizione mensile, codice "M". La colonna Totale indica l'importo complessivo per l'anno.
Le prime due registrazioni si riferiscono all'affitto, che da febbraio a giugno è di 1'000 mensile, mentre da luglio è di 1'200.
C'é anche una data 2025, che è l'importo che si dovrà versare per il riscatto del leasing. In questa riga non vi è nulla nella colonna Totale, perché il movimento non rientra nelle date del periodo contabile definito nelle proprietà file.
Per le spese amministrative conteggiate dalla banca si è usato il codice ripetizione "ME" Fine mese (Month End). Per le registrazioni successive non sarà usato il giorno 28, ma l'ultimo giorno del mese, quindi marzo 31, aprile 30.

Fine trimestre
Qui indichiamo alcune registrazioni tipiche che si ripetono a fine trimestre. Inseriamo la ripetizione 3ME, che significa ripeti ogni 3 mesi, con data fine del mese.

Fine Anno
A fine anno ci sono delle operazioni. Qui usiamo il Ripeti "Y" in modo che queste operazioni saranno eseguite anche per gli anni successivi.

Previsione ricavi e acquisti merce
La previsione dei ricavi è specifica a ogni attività. In questo caso la previsione dei ricavi e degli acquisti viene indicata mese per mese, con un importo specifico.
A partire da marzo è indicata la ripetizione "Y" annuale, così che queste operazioni saranno ripetute negli anni successivi.

Ricavi anno successivo
I mesi di gennaio e febbraio nel primo anno di attività non erano considerati significativi per gli anni successivi, quindi non avevano una ripetizione.
Per i primi due mesi del secondo anno dobbiamo impostare le vendite. Mettiamo anche la ripetizione "Y" annuale così verranno ripetute l'anno successivo.

Prognosen mit Menge und Preis
wird übersetzt
Le colonne Quantità, Unità e Prezzo unitario della tabella Preventivi, permettono di preparare più velocemente delle previsioni.
Il valore della colonna Importo viene calcolato dal programma moltiplicando la Quantità per il Prezzo unitario (ammesso che la colonna Formula sia vuota).
Le colonne Quantità, Prezzo untario, sono impostate come visibili nella Vista Formula.
Vantaggi dell'uso delle colonna Quantità e Prezzi
Le colonne quantità e prezzo sono utile per fare previsioni in base ai quantitativi. Per esempio:
- Nella colonna Unità si può indicare a cosa si riferisce il prezzo.
- Nella colonna Quantità si indica il numero di coperti serviti giornalmente.
- Nella colonna Prezzo si indica il ricavo stimato per ogni coperto.
- La colonna Importo verrà calcolata automaticamente in base ai valori indicati.
Con questo approccio si hanno diversi vantaggi:
- Si possono dettagliare in modo preciso tutti gli elmenti della pianificazione.
- Si ha memoria dei quantitativi e prezzi usati per fare la stima.
- La modifica della pianificazione è molto semplice, si varia solo l'elemento che si desidera.
- Si può verficare come varia l'utile con una variazione delle quantità vendute o del prezzo.
Analisi del break-even.
Berechnungen und Formeln (Javascript)
Funktionen in der Spalte Formel (Ansicht 'Formel der Tabelle Budget).
Datei mit Beispielen
Für Beispiele zu den Formeln bitte folgende Erklärungen lesen:
- Vorlage mit Buchungen mit Benutzen der Spalte Quantität und der Spalte Formel.
- Vorlage mit Buchungen für die Buchhaltung mit Fremdwährungen, die die Spalte Formel für die Basiswährung benutzen.
Spalte Betrag
Zum Planen braucht es den Wert der Spalte Betrag.
Der Wert der Spalte Betrag:
- Kann von Hand eingegeben werden.
- Kann berechnet worden sein:
- Wenn eine Quantität und ein Preis eingegeben worden sind, wird der Betrag das Resultat der Multiplikation dieser Werte sein.
Wenn es nur die Quantität oder den Preis gibt, wird der Betrag 0 sein. - Wenn eine Formel eingegeben worden ist, wird er Betrag das Resultat der Formel sein.
Die Formel hat Priorität auch gegenüber Quantität und Preis. Wenn es eine Formel gibt, wird der Inhalt Quantität und Preis nicht in Betracht gezogen.
- Wenn eine Quantität und ein Preis eingegeben worden sind, wird der Betrag das Resultat der Multiplikation dieser Werte sein.
Berechnungsformeln eingeben (Sprache Javascript)
- Die Formel muss in der Sprache Javascript ausgedrückt werden (nicht zu verwechseln mit der Sprache Java).
- Wenn es eine Formel (oder einen Text) gibt, wird der Wert der Spalte Betrag entsprechend dem Ergebnis der Formel eingerichtet.
- Sie können alle Funktionen der Javascript-Sprache benutzen und ausserdem die API- Schnittstelle von Banana.
Dezimaltrennzeichen
Als Dezimaltrennzeichen verwendet Javascript nur den Punkt ".".
Wenn Sie ein anderes Trennzeichen verwenden, das für Zahlen im lokalen Format verwendet wird, ist es wahrscheinlich, dass die Zahl abgeschnitten wird.
Berechnungsreihenfolge und Fehlen von Zukunftswerten
Wie im Folgenden erläutert, werden die Zeilen nach Datum sortiert und gelöst, indem man vom kleinsten Datum ausgeht.
Wenn es Operationen mit dem gleichen Datum gibt, ist die Reihenfolge die des Einfügens.
Wenn eine Zeile aufgelöst wird, gibt es nur die Ergebnisse der vorherigen Zeilen. Die folgenden Zeilen wurden noch nicht bearbeitet, so dass Sie in der Budgetformel nur die Werte bis zu diesem Zeitpunkt haben.
Das Ergebnis des letzten Vorgangs wird angezeigt.
Der in der Spalte Betrag eingegebene Wert ist das Ergebnis der letzten durchgeführten Operation.
- 10*3 //wird zurückgegeben 30
- Wenn mehrere Operationen nacheinander ausgeführt werden, getrennt durch einen Strichpunkt ";", wird der letzte Vorgang fortgesetzt.
10*3;7; /-Wird am 7. wieder aufgenommen; - Wenn es einen Return gibt, wird der Wert nach dem Return wieder aufgenommen.
return 10; // die 10 wird wieder aufgenommen
Automatische Variablen
- budgetCurrent
Es handelt sich um ein Objekt, das die Tabelle mit den Budgetlinien nach dem Anlegen der Wiederholungen enthält.
Sie werden verwendet, um die Werte in Verbindung mit der JReapeatNumber wieder aufzunehmen. - DEBUG ist eine Variable, die "true" oder falsch sein kann.
Wenn sie "true" ist, werden alle Ergebnisse der Formeln in den Meldungen angezeigt. - row
Es ist ein Javascript-Objekt, das sich auf die aktuelle Zeile bezieht.
Die Werte der Zellen können mit der Funktion value ("columnNameXml") übernommen werden.
row.value ("date") gibt das Datum der Buchung zurück.- row.value ("JRepeatNumber") Gibt den fortschreitenden Wert der Wiederholung zurück.
Die erste Wiederholung ist 0.
- row.value ("JRepeatNumber") Gibt den fortschreitenden Wert der Wiederholung zurück.
Funktionen Budget
Zusätzlich zu den API Budget, definiert in der API der Klasse Buchhaltung, gibt es spezifische Funktionen.
budgetExchangeDifference (account, [date, exchangeRate])
Wenn Wiederholungen angezeigt werden, ist es ratsam, sich auf einen Berechnungszeitraum zu beziehen und nicht auf ein genaues Datum.
Parameter tDate.
- Parameter period.
Eine Abkürzung- "MC", "QC", "YC" um den aktuellen Monat, das aktuelle Quartal oder das aktuelle Jahr anzugeben.
- "MP", "QP", "YP" um den Monat, das Quartal oder das Vorjahr anzugeben.
- Rückgabewert.
Ein Objekt, das aus zwei Daten besteht.- startDate
- endDate
// example
t = BudgetGetPeriod ('2015-01-01', 'MP') gibt zurück
t.startDate // 2014-12-01
t.endDate // 2014-12-31
Spezifische Budgetfunktionen
Zu berücksichtigen:
- "MC", Anstelle des startDate Parameters kann eine der in der budgetGetPeriode erläuterten Abkürzungen "QC", "YC", "YC", "MP", "QP", "YP" verwendet werden.
- Wenn als Datum ein Periodenkürzel angegeben ist, wird das Datum der aktuellen Buchung verwendet.
- Es ist sinnvoll, das Enddatum nur dann zu verwenden, wenn es vor dem Zeilendatum liegt.
Wenn sie gleich oder höher ist, hat sie keine Wirkung, weil die Werte nach der aktuellen Zeile noch nicht verfügbar sind, da sie nicht bearbeitet worden sind.
Liste der Funktionen, die in allen Buchhaltungen verfügbar sind:
- budgetBalance(account, startDate, endDate, extraParam)
Der Saldo bis zur aktuellen Zeile.
budgetBalance('1000', 'MP'); //gibt den Saldo von 1000 am Ende des Vormonats zurück. - budgetOpening(account, startDate, endDate, extraParam)
Der Saldo zu Beginn der Periode. - budgetTotal(account, startDate, endDate, extraParam)
Die Differenz zwischen den Bewegungen Soll und Haben der Periode.
budgetTotal('1000', 'MC'); //gibt die gesamte Bewegung des 1000-Kontos für den aktuellen Monat zurück. - budgetInterest( account, interest, startDate, endDate, extraParam)
Berechnet die Zinsen auf einem Konto für den angegebenen Zeitraum (maximal das Tagesdatum).
Wenn man die Zinsen auf einem Konto am Ende der Periode berechnet, muss die Zeile, wo die Formel angegeben wird, immer die letzte für dieses Datum sein.- Parameter interest,
Gibt den Zinssatz in Prozent an.- positiv (2.5, 4, 10) berechnet die Zinsen der Bewegung Soll des Kontos.
- negativ (-2.5, -4, -10) berechnet die Zinsen der Bewegung Soll des Kontos.
- Parameter interest,
Funktionen für die Buchhaltung mit Fremdwährungen:
Sie können auch für die Buchhaltung ohne Fremdwährungen verwendet werden, in diesem Fall ist das Konto immer in Basiswährung.
- budgetBalanceCurrency(account, startDate, endDate, extraParam)
Der Saldo in der Währung des Kontos, bis zur aktuellen Zeile. - budgetOpeningCurrency(account, startDate, endDate, extraParam)
Der Saldo in der Währung des Kontos, bis zur aktuellen Zeile. - budgetTotalCurrency(account, startDate, endDate, extraParam)
credit( Betrag)
-
Wenn der Parameter Betrag negativ ist, gibt er den Betrag als positiven Wert zurück.
credit(-100) // gibt zurück 100 -
Wenn der Parameter Betrag positiv ist, gibt er 0 (Null) zurück
credit(100) // gibt zurück 0 - Diese Funktion ist in Verbindung mit den anderen budgetBalance-Funktionen nützlich, um nur die Salden zu bearbeiten, die Sie benötigen.
credit(budgetTotal('1000')) //
debit(Betrag)
-
Wenn der Parameter Betrag positiv ist, gibt er den Betrag zurück.
debit(100) // gibt zurück 100 - Wenn der Parameter negativ ist, gib er 0 (Null) zurück
debit(-100) //gibt zurück 0
Nützlich, wenn man Berechnungen erstellen muss, indem man nur den Betrag Soll benutzt und vermeidet, den Betrag Haben zu benutzen.
include
-
include "file:test.js"
Führt den Inhalt der angegebenen Datei aus. Der Name bezieht sich auf die Datei, an der Sie gerade arbeiten. - include "documents:test.js"
Führt den Inhalt des Text-Dokumentes aus, das sich in der Tabelle documents.befindet.
Muss eine Datei vom Typ "text/javascript sein.
Variablen
Sie können Variablen direkt innerhalb der Zeilen definieren und verwenden.
Die Variable muss vorher definiert worden sein.
price = 10;
total = price * 5;
Vom Benutzer definierte Funktionen
Der Benutzer kann Funktionen mit der Javascript-Sprache definieren und in den Formeln aufrufen.
Es können Funktionen definiert werden:
- Direkt in der Formel
- In einem Anhang vom Codetyp Javascript, angegeben in einem Dokument, das als id-Zeile den Namen "_budget.js" trägt.
- Innerhalb eines Textes in der Tabelle Dokumente und eingebunden mit dem include-Befehl
function Steuerberechnen(Gewinn)
{
   var Steuersatz = 10;
   if (Gewinn > 50000)
      Steuersatz = 10;
   else if (Gewinn > 100000)
      Steuersatz =20;
   zurückgeben Gewinn * Steuersatz / 100;
}
Berechnungsreihenfolge und Neuberechnen
Jedes Mal, wenn ein Wert in der Tabelle Budget geändert, oder eine Neuberechnung von Hand erstellt wird (Maiusc+F9), macht das Programm:
- Wenn vorhanden, wird zuerst der Inhalt des Dokuments "_budget.js" ausgeführt.
- Berechnet die Zeilen in der Tabelle Budget neu:
- Das Programm erzeugt die sich wiederholenden Zeilen entsprechend der Spalten Startdatum, Enddatum und Wiederholung.
Wenn es eine Zeile mit einer monatlichen Wiederholung im Januar gibt, werden 12 gleiche Zeilen erstellt, jedoch mit dem Datum für die verschiedenen Monate des Jahres. - Die Zeilen des Budgets werden also nach Datum bearbeitet (wenn sie das gleiche Datum in der Reihenfolge der Eingabe haben.
- Der Betrag der Buchung wird aufgrund der Menge und dem Stückpreis berechnet oder wenn es eine Formel gibt, aufgrund der Formel.
- Für die Buchhaltung mit Fremdwährungen wird zuerst die Formel Betrag in Währung und dann die Formel Betrag in Basiswährung ausgeführt.
Wenn es keine Formel für den Betrag in der Basiswährung gibt, übernimmt das Programm den fixen Wechselkurs und berechnet den Gegenwert in der Basiswährung. - Für die Buchhaltung mit MwSt/USt wird die USt aufgrund des Betrages der Buchung neu berechnet.
- Die zuvor bearbeiteten Zeilen werden für die Berechnung der folgenden Zeilen verwendet.
Der Saldo der Konten zum Zeitpunkt der Zeile des Budgets umfasst nur die zuvor verarbeiteten Beträge.
Wenn in einer Februar-Buchung eine Formel zur Berechnung des Saldos für das ganze Jahr verwendet wird, wird nur der Saldo bis Februar berücksichtigt.
- Das Programm erzeugt die sich wiederholenden Zeilen entsprechend der Spalten Startdatum, Enddatum und Wiederholung.
- Berechnet die Budgetwerte in der Tabelle Konten neu, aufgrund der Budgetzeilen und Eröffnungssalden.
- Es wird der Wert der Spalte Totalsumme in der Tabelle Budget aktualisiert.
Wird das Beginn- oder Enddatum der Buchhaltung oder anderer Werte, die zur Berechnung der Budgetwerte verwendet werden (z.B. MwSt.-Tabelle), geändert, muss eine Neuberechnung manuell durchgeführt werden (Befehl Buchhaltung nachkontrollieren und nachrechnen).
Wenn Sie viele Zeilen, viele Wiederholungen und einen langen Berechnungszeitraum haben, kann eine Neuberechnung der Budgettabelle die Eingabe verlangsamen. Wählen Sie in diesem Fall die manuelle Neuberechnung in der Dateieigenschaft aus.
Examples of the use of formulas in financial forecasts
Below you will find some examples of how to use formulas to automate financial forecasts.
Please refer to the specific documentations:
- Javascript formulas in the Budget table
- Templates with transactions using the Quantity and Formula column

Parameters
When planning, it can be useful to define variables that can and will be used later.
It is useful to create a parameter section with a posting date of January 1st, or another date that corresponds to the first day of the Budget. The parameter variables will then be used in the following rows.
// 30%
costOfGoodsSold = 0.3
// 5%
interestRateDebit = 0.05
// 2%
interestRateCredit = 0.02
// 10 %
latePaymentPercentage = 0.1
This way, all parameters that can be set are displayed instantly. When a parameter is changed, the forecast is recalculated.
Repetitions or values per month
By using the repeat column, you can plan for the whole year on one recording row.
If however, the activity has seasonal variations, it is recommended to use a forecast by month. For each month, a row is created with the sales amount for the month.
If you wish to make forecasts automatic for several years, it is useful to insert the repetition "Y" in this row, so that the row of the year is also used for the next one.
Prices and sales quantities
When making a sales plan it will be easier to enter values using the quantity and price column. For example, a restaurant can enter the number of covers served per day, week or month and the program automatically calculates the amount. By changing the number of covers or the price, the impact on liquidity and on the result for the year is instantly displayed.
Use of formulas with variables for growth
Use formulas, which are expressed in the Javascript language:
- The variable must be defined before being used, hence the line, in which it is defined, must be a date preceding the the line in which it is used.
- Thousands separators in numbers can't be used.
- The decimal separator is always the "." (Full stop)
- The names are different for uppercase / lowercase.
You can assign a value to a variable (this name can be freely chosen) and enter the variable name in the following lines to resume the value.
By changing the value assigned to the variable, all the lines, in which the variable is used, are automatically modified.
As an example, you may set the expected sales amount, proceeding with the following months, by using a formula to increase the amount.
- Create a "S" (sales) variable , by entering the following text in the Formula column.
Sales=1000
The value 1000.00 will be inserted in the amount column - In the following lines use the variable by simply inserting the variable name in the formula:
Sales
The value 1000.00 will be inserted in the amount column - You can add 10% to the amount (multiplying by 1.1)
Sales*1.1
The value 1100.00 will be inserted in the amount column (The value of the Sales variable does not change) - You can increase the value of S
Sales=Sales+200
The value 1200.00 will be inserted in the amount column (The value of the Sales variable will change) - If the variable is used in the following line, there will be the new calculation
Sales
The value 1200.00 will be inserted in the amount column
You can also define a variable to define the percentage of growth.
- Percentage=1.1
- Amount=200
- In formulas you can use the variable name instead of the number
- Sales*Percentage
- Sales=Sales+Amount
Variables and repetitions
Let's say you expect the turnover to rise by 5% every month.
- Enter two lines where you assign the value to the variable, without putting any account with the start date of the year.
Sales=1000
Increment=5 - Then create a line with the repetition where you enter the accounts and the formula
Sales=Sales*(1+Increment/100)
Each time the row is repeated the value of the variable S will be increased by 5% and consequently also the amount of the transaction. By simply changing the growth percentage, the forecast will be recalculated.
In a row you can also insert multiple Javascript instructions, by separating them with a semicolon ";"
Sales=1000; P=5
Use of budget formulas
There are functions that allow you to access the balances and movements of the accounts for planning up to the row that is calculated.You can enter a formula that through the budgetTotal function, recovers the value of the sales account "SALES" of the previous month.
credit( budgetTotal("SALES", "MP") )
The budgetTotal function takes account numbers and periods as arguments. An abbreviation can be used instead of the period.
- MP stands for previous month.
- QP stands for previous quarter.
Revenues show in Credit, therefore the value returned by the function will be negative and will not be accepted as an amount in the double entry accounting.
Therefore use the credit () function, which uses the negative value and turn it into a positive value.
Variables for monthly sales
Sales may vary for each month. In this case it is useful to use separate registrations for each month with the variable name.
sales_01 = 1000
cost_01 = sales_01 * costOfGoodsSold
sales_01 = 1100
Deferred payments
If you want a very precise liquidity plan, it is useful to separate the sales, which are paid immediately and those that are deferred.
One approach may be to record all sales as if they were paid cash, assigning the value of the monthly variable to the amount.
sales_01 = 1000
A registration is then entered, which reverses the sales that are deferred, calculating the amount with the formula.
sales_01 * latePaymentPercentage
A payment registration with the same formula will then be inserted for the following month.
Selling costs
There are costs that can be related to sales (cost of goods) or to other costs (social charges, in relation to wages).
Cost calculation with variables
If the sales are defined with variables, the sales costs can also be indicated as a percentage of the sales.
- You can define variable S for sales and variable C for the percentage of the cost.
Sales=1000
Cost=60 - The formula for the calculation will be:
Sales*Cost/100
You can also use the same approach to calculate social security charges.
This formula can possibly be entered in a repetitive row.
Sales cost calculation with budget functions
When the costs are related to sales, the budget formula can also be used.
credit( budgetTotal("SALES", "MC") )*60/100
When the costs related to sales, "MC" stands for the current month.
This formula will return the sales value of the current month, turn them into a positive and multiply them by 60 and divide by 100.
The date must be beyond the sales registration dates, obviously.
It may be used it in a repeat row, inserting the month end date. Therefore, the costs of the sale will automatically be calculated based on the sales entered with the transaction.
The formula can be combined with variables.
- At the beginning of the year define the percentage of costs.
Cost=60 - Therefore, the formula C is used.
credit( budgetTotal("SALES", "MC") )*Cost/100
When you change the contribution percentage or any sale, the schedule will be updated automatically.
Sales commission calculation at the end of the year
At the end of the year, you calculate the commissions of 5% on the total net sales with this formula:
credit( budgetTotal("SALES", "YC") )*5/100
The bugetTotal function returns the movement of the sales account for the period "YC", current year. With the credit () function, the amount is turned into a positive value and then multiplied by 5 and divided by 100.
If you make forecasts over several years, remember to insert the repetition "Y" in the row, so that the same formula will be also calculated for the previous year. As indicated above instead of entering the 5 directly in the formula, you can assign it with a variable.
- Commission=5
- credit( budgetTotal("SALES", "YC") )*Commission/100
If the percentage changes from one year to the next, it is sufficient enter a transaction with the following year date that resets the variable for commissions.
Inflation with variables
If you want to forecast over several years, you can also take inflation into account.
- At the beginning of the planning, assign a base variable for prices and inflation (2%).
Base=1;Inflation=2 - When you use the Sales variable, you multiply it by the inflation rate
Sales=Sales*Base - At the beginning of the following year, with annual repetition, you increase the price base
Base=Base+Base*Inflation/100
Depreciation calculation
Thanks to the formulas, the calculation of depreciation can be automated.
If you change the value of your investments in planning, depreciation will be automatically recalculated. Make sure that the date of the depreciation calculation line has a date superior to that of the investments. Date is generally 31st December .
Depreciation calculation on book value
To calculate the depreciation of the "EQUIPMENT" account, insert a line at the end of the year with the following formula and the debit and credit accounts appropriately set up to register the depreciation.
budgetBalance("EQUIPMENT")*20/100
The budgetBalance function returns the balance to that date. The amortization of 20% is then calculated on this.
Use the debit function, in case you think the asset account can go into credit.
debit(budgetBalance("EQUIPMENT"))*20/100
Calculation of depreciation on the initial value
To calculate the initial value of the investments, it is necessary to use variables to remember the value of the initial investment.
Equipment=10000
If the depreciation is spread over 5 years, the formula will be inserted in the year-end depreciation line
Equipment=10000/5
The annual repetition "Y" and the end date, which corresponds to the date of the last installment of the amortization, will be inserted in the row to prevent the amortization from running on indefinitely.
For each investment you will have to create a variable and a specific row of depreciation. Numbers can also be entered in variable names.
Equipment1=10000
Equipment2=5000
Interest calculation
The budgetInterest( account, interest, startDate, endDate) function allows you to automatically calculate interest based on the actual use of an account.
The parameters are:
- Account
Whose movements are used to calculate interest, in case it will be the bank account or the loan. - Interest
The interest rate in percentage.
If the value is positive, interest on the debit balances is calculated.
If the value is negative, interest on the credit balances is calculated.. - Initial date, which may also be an acronym.
- End date, which may also be an acronym.
- The returned value is the interest calculated for 365/365 days.
Interest expense on the bank account
To calculate the interest expense of 5%, insert a line with the end date of the quarter and the repetition "3ME", which contains the formula
budgetInterest( "Bank", -5, "QC")
The interest rate is negative, because "QC" means current quarter. The debit and credit accounts must be the usual ones for recording interest expense. If the interest decreases the bank account balance will also be used in the registration. However, another account can be used if it is paid with another account.
It is important that the "3ME" repeat is used so that the date used will always be the last of the quarter.
To calculate the interest of the month use the abbreviation "MC"
budgetInterest( "Bank", -5, "MC")
Interest on the bank account
For interest income of 2%, use positive interest instead.
budgetInterest( "Bank", 2, "QC")
Interest on fixed-term loan accounts
For fixed-term loans, interest will be calculated and recorded on the specified date.
- Create an separate account for each loan.
Use the budgetInterest function indicating exactly the start and end dates .If the date is indicated as text, the notation "yyyy-mm-dd" should be used, then "2022-12-31" - Use variables.
As indicated for depreciation, the loan amount can be assigned to a variable. The interest calculation will be done with a Javascript calculation formula,- Define the loan variable
Loan=1000 - 5% interest calculation, for 120 days.
Loan*5/100*120/365.
- Define the loan variable
Profit tax calculation
Profit is the total of the group's profit for the specified period.
To calculate a 10% profit tax, use the following formula.
credit(budgetTotal("Gr=Result","MC"))*10/100
- Use the the budgetTotal function parameter in the "Gr = Result" group, which indicates that instead of an account it has to calculate the movements for the group.
- MC, current month, is indicated as the period.
- The budgetTotal function will return a positive value if there is a loss and negative (credit) if there is a profit.
- the credit function takes only negative values into account, therefore if there is a loss the tax will be zero.
Payments with deferred or different deadlines
For deferred payments or with different deadlines, you can proceed in two ways:
- Use variables to which payment amounts are to be assigned.
Use the variable in question when recording the payment. - Create customer or supplier accounts for different credit deadlines.
Other cases
Please tell us about your other requirements, so we can add more examples.
Finanzplanung einrichten
Tabelle Budget hinzufügen
Falls die Buchhaltungsdatei noch nicht über die Budget-Tabelle verfügt, kann sie wie in folgender Anleitung Tabelle Budget hinzufügen vermerkt hinzugefügt werden.
Nur für Finanzplanung
Die Datei der Buchhaltung wird ebenfalls für die Erstellung der Finanzplanung verwendet. Wird ausschliesslich eine Finanzplanung gemacht, werden in der Buchungen-Tabelle keine Buchungen erfasst
- Für eine Start-Up
- Zur Vorbereitung von Finanzplänen für ein neues Unternehmen, die noch keine Finanzpläne erstellt hat.
- Befindet man sich noch in der Anlaufphase, kann es zunächst nützlich sein, eine Vorlage mit wenigen Konten ohne MwSt zu verwenden.
- Wenn man ebenfalls eine Buchhaltung zu führen wünscht, ist es sinnvoll, mit einem Kontenplan zu beginnen, der bereits für ein reales Unternehmen eingerichtet wurde.
- Für ein bestehendes Unternehmen
- Die Buchhaltung wird mit einem anderen Programm geführt.
- Es wird der für die Buchhaltung verwendeten Kontenplan angepasst.
- Um einen tatsächlichen Vergleich zu erhalten, so vorgehen:
- Budgetzahlen exportieren und in das Buchhaltungsprogramm importieren.
- Buchhaltungsdaten exportieren und in die Planungsdatei importieren.
- Excel-Tabellen erstellen, in welchen die Planungs- und Buchhaltungsdaten übernommen werden.
Finanzplanung einrichten
Die Vorgehensweise ist dieselbe, unabhängig davon, ob man nur eine Buchhaltung, eine Planung oder beides zusammen verwaltet:
- Eine Buchhaltungsdatei erstellen.
- Dateieigenschaften (Menü Datei, Befehl Eigenschaften (Stammdaten) definieren.
- Einen Kontenplan einrichten.
- Anfangssalden eingeben (falls vorhanden).
- Prognosewerte in die Budget-Tabelle eingeben.
Die Tabelle Buchungen bleibt jedoch voreingestellt, wenn man sie nicht sehen möchte, kann man sie über das Daten-Menü -> Tabelleneinstellungen mittels Option 'Sichtbar' ausblenden.
Buchhaltung und Finanzplanung befinden sich in derselben Datei
Die Datei der Buchhaltung wird ebenfalls für die Erstellung der Finanzplanung verwendet:
- In der Konten-Tabelle (bei Einnahmen-Ausgaben Rechnung in den Tabellen Konten und Kategorien) verfügt man über die Bilanz und die Erfolgsrechnung und kann nach Wunsch Konten (bei Einnahmen-Ausgaben-Rechnung Konten und Kategorien) sowie Gruppen hinzufügen.
- Die Spalte 'Eröffnung' der Konten-Tabelle gilt auch für die Budget-Daten.
- In der Buchungen-Tabelle werden die Buchungen für vergangene Tätigkeiten bzw. der normalen Buchhaltung erfasst.
- In der Budget-Tabelle werden die für die Zukunft vorgesehenen Buchungen bzw. der Finanzplanung erfasst.
- In den diversen Reports (Bilanz, Erfolgsrechnung, Kontenauszüge ...) wird wie folgt unterschieden:
- Die aktuellen Werte, welche aufgrund der Eröffnung sowie den in der Buchungen-Tabelle erfassten Bewegungen berechnet werden.
- Die Budgetwerte, welche aufgrund der Eröffnung sowie den in der Budget-Tabelle eingetragenen Buchungen berechnet werden.
- Die Vergleichswerte entsprechen der Differenz zwischen den Budget- und aktuellen Werten, welche Ende Jahr als endgültig erachtet werden.
Wird ausschliesslich eine Finanzplanung gemacht, werden in der Buchungen-Tabelle keine Buchungen erfasst und es werden in den Reports nur Budget-Daten angezeigt.
Zeitraum für die Berechnung und Projizierung der Planungsdaten
Das Programm berechnet die Planung wie folgt:
- Für die kontextbezogene Prognose verwendet es den in den Dateieigenschaften (Menü Datei, Befehl Eigenschaften (Stammdaten) definierten Zeitraum.
- Für Berichte und Kontoauszüge wendet es den im spezifischen Bericht definierten Zeitraum an.
Es berechnet für den gesamten angegebenen Zeitraum die Prognose, indem es die entsprechenden Wiederholungslinien erzeugt.
In Bezug auf den Zeitraum empfiehlt sich folgendes:
- Als Planungszeitraum das erste Planungsjahr verwenden.
Daraus ergeben sich Werte für Wiederholungen, die besser verständlich sind, da sie auf Jahresbasis angegeben werden. - Wird eine Mehrjahresprojizierung gewünscht, in den einzelnen Berichten die Periode des gewünschten Prognosezeitraumes angeben.
Übergang auf das neue Jahr
Die Funktion Neues Jahr erstellen (Menü Buch2) von Banana Buchhaltung ermöglicht es daher, auch die Budgetbuchungen vorzutragen.
- Auf der Ebene jeder Zeile besteht die Möglichkeit, anzugeben, ob sie vorgetragen werden soll oder nicht und ob das ursprüngliche Datum beibehalten oder durch das neue Jahresdatum ersetzt werden soll.
- Die Erstellung des Budgets für das neue Jahr ist somit sehr einfach, denn es geht alleinig darum, die Ausgaben- und Einnahmenposten anzupassen, welche sich voraussichtlich ändern werden.
Ausdrucke und Berichte der Finanzprognosen
Kalkulation der Planung
Die für die Planung relevanten Daten werden unter Berücksichtigung der folgenden Punkte berechnet:
- Eröffnungssaldi der Tabelle Konten.
- Budgetbuchungen, welche in der Tabelle Budget erfasst wurden
- Vom Programm automatisch aufgrund der in den Budgetbuchungen angegebenen Wiederholungs-Einstellungen erzeugte Budgetbuchungen.
Je länger die Wiederholungsperiode ist, desto mehr Budgetbuchungen gibt es.
Berechnungs- und Datenprojektionszeitraum
Das Programm berechnet die Finanzplanung wie folgt:
- Für die kontextbezogenen Prognosedaten benutzt es den unter Menü Datei, Befehl Eigenschaften (Stammdaten) angegebenen Zeitraum.
- Für Ausdrucke und Kontoauszüge benutzt es den für den spezifischen Report angegebenen Zeitraum.
Die Prognose für den gesamten angegebenen Zeitraum wird berechnet, indem die entsprechenden Wiederholungszeilen erzeugt werden.
In Bezug auf den Zeitraum wird folgendes empfohlen:
- Als Planungszeitraum das erste Planungsjahr verwenden.
So erhält man auf Jahresbasis angegeben Wiederholungswerte, welche besser verständlich sind. - Wird eine Prognose auf mehrere Jahre gewünscht, ist der gewünschte Prognosezeitraum in der jeweiligen Perioden-Registerkarte des einzelnen Reports anzugeben.
Kontextuelle Anzeige der Budgetdaten
Die Budgetdaten werden sofort aktualisiert und gleichzeitig sichtbar gemacht.
Die Geschwindigkeit der Berechnung hängt von den folgenden Kriterien ab:
- Anzahl der Konten und Gruppen der Tabellen Konten und Kategorien
- Anzahl der in der Tabelle Budget erfassten Zeilen
- Anzahl der Budgetzeilen mit Wiederholung
- Vorhandensein von Formeln
- Eingestellter Planungszeitraum. Je länger der Zeitraum ist, desto grösser ist die Anzahl der Wiederholungsbuchungen.
Die Werte werden nach jeder Änderung neu berechnet.
Erfolgt die Berechnung langsam, kann das Visum der Option 'Totalsummen manuell nachrechnen' unter Eigenschaften (Stammdaten) (Menü Datei) durch setzen eines Visums aktiviert werden.
Um die aktualisierten Werte zu erhalten, ist somit der Befehl Totalsummen nachrechnen (Menü 'Buch1' auszuführen.
Total-Spalte der Budget-Tabelle
Die Spalte 'Total' enthält den Gesamtbudgetbetrag für die unter Menü Datei, Eigenschaften (Stammdaten) angegebene Buchhaltungsperiode (Periode zwischen 'Anfangsdatum' und 'Enddatum').
- Wenn es sich um eine einzelne Transaktion handelt, entspricht der Betrag demjenigen der Budgetbuchung.
- Wenn es sich um eine Transaktion mit Wiederholung handelt, entspricht der Betrag der Summe der Beträge aller Wiederholungen, die in die Buchhaltungsperiode fallen.
- Die Spalte 'Total' ist leer, wenn das Datum über die Buchhaltungsperiode hinausgeht.
Budget-Spalte der Konten- und Kategorientabelle
In den Tabellen Konten und Kategorien werden die aktualisierten Budgetwerte für die unter Menü Datei, Eigenschaften (Stammdaten) angegebene Buchhaltungsperiode (zwischen 'Anfangsdatum' und 'Enddatum' liegender Zeitraum) angezeigt.
- Spalte 'Budget'
Gibt die Budgetsumme des Kontos für die Abrechnungsperiode an.
Der angegebene Wert beinhaltet den Eröffnungssaldo sowie die Budgetbewegungen für die Periode. - Spalte 'Differenz Budget'
Gibt die Differenz zwischen den Spalten 'Budget' und 'Saldo' an.
Budgetdaten-Kontoauszug
Mit dem Befehl Kontoauszüge aus Menü 'Buch1' kann das Detail mit allen Budgetbewegungen erhalten werden.
- Im Dialogfenster Kontoauszüge
- In der Registerkarte 'Konten' kann zwischen den Optionen 'Effektive Buchungen' sowie 'Budget Buchungen' gewählt werden.
- In der Registerkarte 'Periode' kann die Berechnungsperiode angegeben werden. Wird ein 'Enddatum (inbegriffen)' gewählt und erfasst, welches über das Enddatum der Buchhaltung, erstellt das Programm automatisch eine Projektion der angegebenen Daten.
- Wird der Kontoauszug der Tabelle Budget bzw. der Budgetbuchungen geöffnet, wird die Tabelle mit den Budgetbewegungen angezeigt.
Finanzpläne (Buchhaltungsreports)
Bis auf wenige Ausnahmen ermöglichen alle Buchhaltungsreports die Anzeige der Budgetdaten.
- Es reicht, die Spalten 'Budget' und 'Differenz Budget' sichtbar zu machen.
Somit kann folgendes erhalten werden:
- Die Prognose-Bilanz.
- Die Prognose-Erfolgsrechnung.
- Der Liquiditätsplan.
Detail mit der Entwicklung der Saldi der einzelnen Konten oder Liquiditätsgruppen. - Der Investitionsplan.
Detail mit der Entwicklung der Saldi der einzelnen Konten oder Anlagengruppen. - Der Finanzierungsplan.
Detail mit der Entwicklung der Saldi der einzelnen Konten oder Gruppen, die Finanzierungen gruppieren. - Entwicklung der Projekte.
Detail der Kosten- und Profitstellen.
Alle für die Buchhaltung verfügbaren Personalisierungen sind auch für die Finanzplanung anwendbar:
- Die gewünschte Gruppierungsebene auswählen.
Präsentation mit Kontendetails oder nur mit Gruppen. - Auswahl der Sektionen, die eingeschlossen werden sollen.
Es kann nur die Bilanz, die Erfolgsrechnung bzw. die Kosten- und Profitstellen gedruckt werden. - Wahl der Buchhaltungsperiode.
Wird ein 'Enddatum (inbegriffen)' gewählt und erfasst, welches über das Enddatum der Buchhaltung, erstellt das Programm automatisch eine Projektion der angegebenen Daten. - Unterteilung nach Periode (monatlich, vierteljährlich, halbjährlich, jährlich).
Es werden für jede Art von Unterteilung Spalten erstellt und eine weitere für das Total der gewählten Periode.
Die Kombination der Berechnungsperiode sowie Unterteilung erlauben es, Ad-hoc-Berichte zu erstellen.- Wird als Periode 1 Jahr ohne Unterteilung angegeben, erhält man die Jahresprognose für 1 Jahr.
- Wird als Periode 1 Jahr mit vierteljährlicher Unterteilung angegeben, erhält man einen Ausdruck mit Spalten für jedes Quartal.
- Wird als Periode 6 Monate mit monatlicher Unterteilung angegeben, sieht man die detaillierte Entwicklung pro Monat.
- Wird als Periode 5 Jahre mit jährlicher Unterteilung angegeben, verfügt man über Spalten mit der Entwicklung für die 5 Jahre.
- Vergleich der aktuellen Werte mit den Budgetwerten.
- Hinzufügen von weiteren Spalten.
- Änderung des Drucklayouts.
- Speichern von Druck-Stilart.
Die Druckeinstellungen können als Komposition gespeichert und später wieder aufgerufen werden.
Es können beliebig viele Kompositionen erstellt werden.
Provisional Balance Sheet
The Balance Sheet forecast displays the Balance Sheet for a future period. It is an important tool for tracking the management of your company and allows you to verify what the company's capital structure will be like, the state of assets, of liabilities and the equity.
With Banana Accounting, thanks to the forecasting with the double entry method, you have complete forecast budgets and that you can arrange in different ways. The program also calculates forecasts over several years.
You can access a very precise vision of what the future balance sheet will look like.
The structure of the budget is the same as that used in the accounting file. When printing, you can indicate which values to display, those of the final balance, the estimate or both of those.
The forecast values are calculated taking into account the opening balances and forecast movements indicated in the Budget table. When you change a budget entry, the forecasts are instantly updated. You can simulate and test, relocate a payment, add an investment, modify sales and see how the budget changes over time.
Budget forecast values can be displayed in several ways.
Detailed forecast
The financial forecast, based on the double entry method, allows to obtain the forecasts of the balance sheet values, using the same accounts and groups as those of the accounting file. The same structure of the items that make up the financial statements is used for forecasting. Values and reports are available automatically to display in detail, day by day, how liquidity evolves, the situation of customers.
The Banana Accounting forecast presents the values for assessing the financial, equity and economic situation. The structure is customizable, it can be presented in a simple way, including the main groups and the accounts that are part of it, or in a more complex way, by inserting subgroups, for a more detailed view.
ASSETS
Current assets
- Liquidity
- Credits
- Inventory
Fixed assets
- Movable assets
- Real estate
LIABILITIES
Third party capital
- Short term debt
- Long term debt
Own capital
- Reserves
- Profit/Loss previous years
- Profit/Loss current year
Account table
In the Budget column of the Accounts table you access forecast values for all accounts and balance groups available. In a glance you have an instant overview of the budget. The values refer to the accounting period and the variations are calculated automatically with respect to the current balance.
If you need more details, you can add accounts or groups.

Enhanced Balance sheet with groups
Through Enhanced Balance Sheet with groups command, you can view the Provisional Balance Sheet, choosing the presentation mode you need.
- Indicate the values of the Budget in the columns section.
You can display the current (accounting) values, the estimate values or both. - Set up the Period.
If a period that exceeds the accounting period, is indicated, the program will automatically switch to budgeting over several years. - Indicate the subdivision by period required.
- In the Rows section, you can exclude accounts and thus have a view of groups only.
- If you think you're use this print setting again, create a Composition.
Using the different options you can customize your prints. Below are some examples.
Forecast balance sheet at the end of the current year
This print has been set up with the figures for the current year only.

Forecast budget and comparison with the current year
The final (current) figures are compared with those of the estimate.
You can also view the variation as an amount and a percentage.
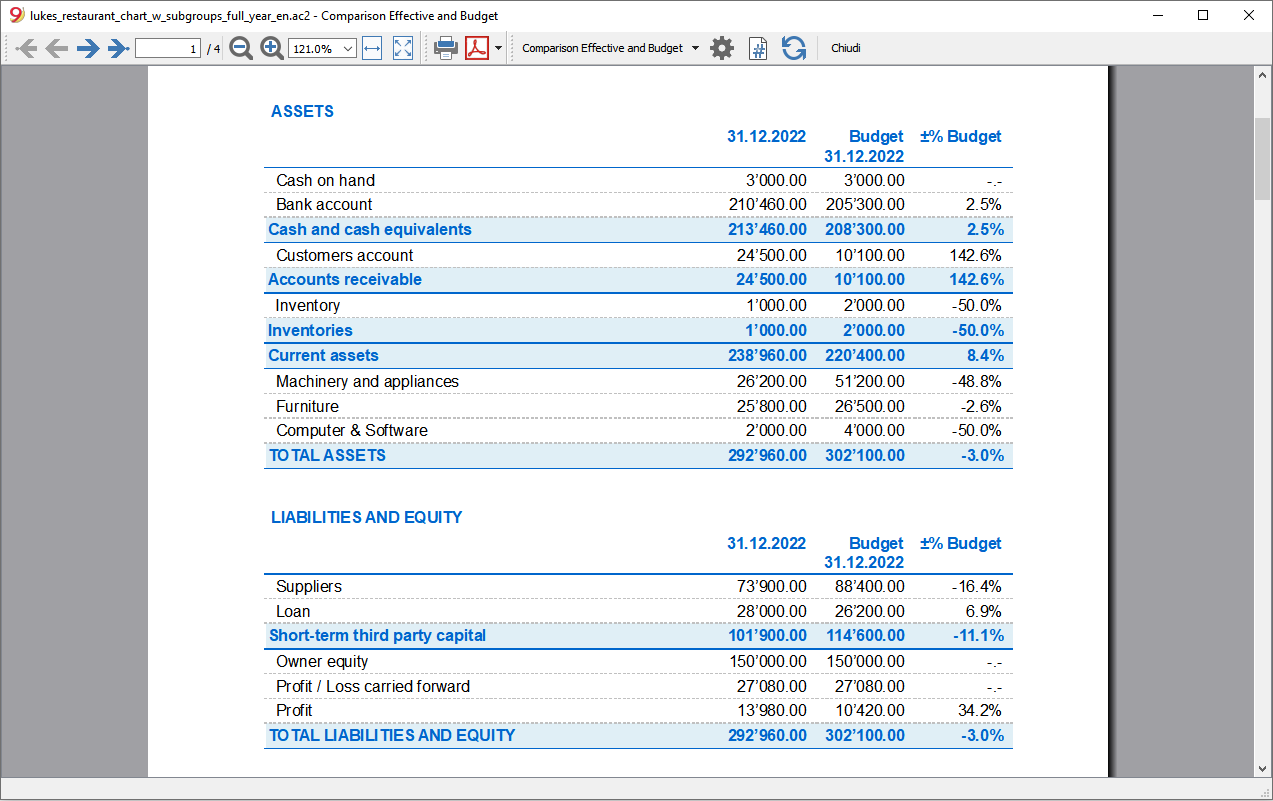
Quarterly budget
In the Subdivision section set to quarterly and the schedule shows the budget at the end of each quarter.
The evolution of the budget forecast during the year can be tracked.

Quarterly budget with comparison
This printout is set up to print both the estimate and the final balance. We therefore have the expected and current situation at the end of each quarter.

Three-year budget
This printout is set up to print the three-year budget forecast.
In the Period section set the reference period to three years and in the Subdivision section set to one year. In the File properties (File menu) there must be 3 years as the start and end period (e.g. start 01.01.2022 - end 31.12.2024).

Accounting Report
The Accounting Report is similar to the one for Enhanced balance sheet with groups, with the difference that the display takes place in the Accounts table in columns.
You can therefore use it to get an instant view of the evolution of liquidity accounts.

Provisional Profit and Loss account
The Income statement forecast presents the profits, costs and result for a future period. It is an important tool for tracking the management of the company which allows you to understand how the financial situation will evolve.
With Banana Accounting, thanks to the forecasts with the double entry method, you have complete forecast budgets and that you can organize in different ways. The program also calculates forecasts over several years.
You can have a very precise vision of the evolution of the economical situation.
The structure of the Income statement is the same as that used in accounting file. When printing, you can indicate which values to display, those of the final balance, or the budgeted balance or of both.
The forecast values are calculated taking into account the opening balances and forecast movements indicated in the Budget table. When you change a budget entry, the forecasts are instantly updated. You can simulate and test, relocate a payment, add an investment, modify sales and see how the budget changes over time.
Income statement values can be displayed in several ways.
Use of quantities and formulas
The quantity and price column of the Budget table allow you to prepare more realistic forecasts, using the same methodology as spreadsheets. This allows for faster simulations. It is sufficient that you change the price and you access the new forecasts of the income statement automatically and also those of the Balance Sheet and Liquidity.
The formulas allow you to automate cost calculation, so that for example, when you change sales the purchase costs change in percentage. In this way you can use precise income statement forecasts that update automatically. Formulas are particularly useful when making forecasts over multiple years.
Detailed forecasts
The Income statement forecast, based on the double entry method, allows you to obtain the forecasts of the costs and revenues, using the same accounts and groups as those of the accounting file. The same structure of the items, that make up the income statements, is used for forecasting. Values and reports are available automatically to display in detail, day by day, how liquidity evolves and the situation of customers.
The structure of the Chart of Accounts, on which the forecast is also based, is customizable. This can be done by simply using the main groups and the accounts that are part of it, or more in a more complex way, by also inserting subgroups, for a more detailed view.
The structure of the Profit and Loss Account is gradually scaled and allows you to view the interim and final results for the year after paying the taxes.
INCOME STATEMENT
- Revenues.
- Cost of goods.
Gross operating result (total of Revenues and Costs).
- Staff costs
- General costs.
Operating result (total of the gross operating result, personnel costs and general costs).
- Financial costs.
Operating result before taxes and depreciation(Total of operating result and financial costs).
- Depreciation.
Operating result before taxes (Total of ordinary Result and Depreciation).
- Taxes
Profit and Loss before Taxes (total of the Result before taxes and Taxes and duties).
Accounts / Category Table
In the Budget column of the Accounts table, for double entry accounting, and of the Categories table for revenue and expenditure, the forecast values for all the accounts and groups of the Income statement are displayed. With a glance you have an instant view of the forecasted Income statement. The values refer to the accounting period and the variations are compared to the current balance.
If you require more details, you can add accounts or groups.

Enhanced Balance sheet with groups
Through Enhanced Balance Sheet with groups command, you can view the Provisional Balance Sheet, choosing the presentation mode you need.
- Indicate the values of the Budget in the columns section.
You can display the current (accounting) values, the estimate values or both. - Set up the Period.
If a period that exceeds the accounting period, is indicated, the program will automatically switch to budgeting over several years. - Indicate the subdivision by period required.
- In the Rows section, you can exclude accounts and thus have a view of groups only.
- If you think you're use this print setting again, create a Composition.
Using the different options you can customize your prints. Below are some examples.
Forecast balance sheet at the end of the current year
This print has been set up with the quote values for the current year only.

Forecast income statement and current year comparison
The final (current) values are compared with those of the forecast.

Quarterly forecast income statement
In the Subdivision section set quarterly and the program shows the forecast income statement for the various quarters.
The evolution of the budget forecast during the year will now be displayed.

Quarterly budget with comparison
This printout is set up to print both the estimate and the final balance. We therefore have the expected and current situation at the end of the quarters.

Three-year forecast for Profit and Loss account
If you insert the forecast movements with the repetition code, the program is able to prepare forecasts beyond the defined period.
To obtain forecasts over several years, the transactions are entered in the Budget table with repetition (Y).
The printout is set up to obtain the estimate of the income statement over three years.

Accounting Report
The Accounting Report is similar to the one for Enhanced balance sheet with groups, with the difference that the display takes place in the Accounts table in columns.
You can therefore use it to get an instant view of the evolution of liquidity accounts.

Liquidity Planning
Cash is King is the motto that indicates how important liquidity is. It is the main engine for carrying out business activities, meeting commitments and producing profits. To invest safely, it is essential to evaluate the ability to produce liquidity and its evolution over time a rational way.
The financial forecast of Banana Accounting is an important business management tool, which allows you to understand if there will be enough financial means to meet commitments and reduce your debt exposure to the maximum.
Liquidity projections are calculated on the basis of the initial balance and forecasts included in the Budget table. When a budget movement is changed, the forecasts are instantly updated. You run simulations, assign a payment, add an investment, modify sales and see how liquidity evolves.
Liquidity values can be displayed in several ways.
Accounts table
Set up accounts and liquidity groups in the Accounts table. In the Budget column you will also see the updated forecast balances for the accounting period. At a glance you will know what the liquidity situation will be at the end of the year.

Evolution graphs
When you open the Graphs window, positioning the cursor on an account or a group you will see the graph of the evolution of Liquidity.
If you click on the Current, Previous or Estimate caption, you can hide the graph.
Account card with estimate data
Using Account card command you have the possibility to see in detail, day by day, how liquidity evolves. You can see all the movements that have an impact on liquidity.

The Account card command allows you to specify if you want to see current or budgeted movements.
- Select budget movements.
- Set the period
If you indicate a period that exceed the accounting period, the program will automatically generate Forecasts over several years. - If you indicate a group, you will see the movements of all the accounts belonging to that group.
- When you are in the Budget table, you can access the account card with a click on the icon next to the account.
Enhanced Balance sheet with groups
Through Enhanced Balance Sheet with groups you may select to work with values subdivided by column per period. In this way you can see the evolution of liquidity by day, week, month, quarter, semester, year, etc.
- In Columns section indicate that you wish to view the Budget values.
- In Sections you can select the accounts or groups you want to include in the printout.
You may select to display the asset and depreciation accounts only. - Set up the Period.
If a period that exceeds the accounting period, is indicated, the program will automatically switch to budgeting over several years. - Indicate the subdivision by period required.
- If you think you're use this print setting again, create a Composition.

Accounting Report
The Accounting Report is similar to the one for Enhanced balance sheet with groups, with the difference that the display takes place in the Accounts table in columns.
You can therefore use it to get an instant view of the evolution of liquidity accounts.

Forecasting sales
Sales for a company are the main source of income and liquidity. Unlike costs that are more easily planned, sales are more difficult to budget. As a rule of thumb, you may base yourself on the figure of the sales of the previous year for the same period or, on the possibility important events that are in the pipeline and could lead to an increase in sales or even to the acquisition of new customers.
Based on this concept, Banana accounting, with the forecast based on double-entry accounting, allows you to simulate and project different scenarios over time. Just change the budgeted amounts for sales and the program automatically updates the forecasts and displays detailed reports for the current year or for future years.
The sales projections are calculated on the basis of the forecasts included in the Budget table and can be displayed in different ways.
Accounts table
Set up accounts and sales groups in the Accounts table. In the Budget column you will also have the updated forecast balances for the accounting period. You can check what the evolution of sales will be during the year, at a glance

Evolution chart for sales
If you display the Graphs window, position the cursor on an account or a group and you will see the graph of the evolution of the sales.
If you click on the Current, Previous or Budget caption, you can hide the graph.
Account card with Budget data
With the Account card you are offered the possibility to display in detail and day by day, how sales evolve. You can examine all the movements that impact sales.

The Account card command allows you to specify if you want to display current or budgeted movements.
- Select thebudget movements.
- Set the period.
If you indicate a period that extends beyond the accounting period, the program will automatically generate Forecasts over several years. - If you indicate a group, you will see the movements of all the accounts belonging to that group.
- When you are in the Budget table, you can access the account card with a click on the icon next to the account.
Enhanced Balance sheet with groups
Through Enhanced Balance Sheet with groups you may select to work with values subdivided by column per period. In this way you can see the evolution of liquidity by day, week, month, quarter, semester, year, etc.
- In Columns section indicate that you wish to view the Budget values.
- In Sections you can select the accounts or groups you want to include in the printout.
You may select to display the asset and depreciation accounts only. - Set up the Period.
If a period that exceeds the accounting period, is indicated, the program will automatically switch to budgeting over several years. - Indicate the subdivision by period required.
- If you think you're use this print setting again, create a Composition.

Financial forecasting for customers
Customers forecasting completes financial planning with customer data. For example, a company can forecast sales by indicating accounts for the most important customers.
Forecasting with the double entry method also allows you to indicate accounts for individual clients. Depending on the requirement, customer management can be done with balance sheet accounts, profit and loss accounts or with cost and profit centers.
When changing a budget movement, the forecasts for each customer are also updated individually.
Accounts table
Set up accounts for customers in the Accounts table. In the Estimate column you will also have the updated forecast balances for the accounting period. At a glance, you can view what the forecast for the individual customer will be.

Evolution chart
If you display the Graphs window, positioning the cursor on an account or a group you will see the graph for the evolution of the customers.
If you click on the Current, Previous or Estimate caption, you can hide the graph.
Account card with estimate data
With the Account card command you have the possibility to see in detail all the movements for each customer.

- Select budget movements.
- Indicates the customer's account.
- Set up the period.
If you indicate a period that extends beyond the accounting period, the program will automatically generate Forecasts over several years. - When indicating a group, you will see the movements of all the accounts belonging to that group.
- When in the Budget table, you can access the customer's card with a click on the small icon next to the account number.
Enhanced Balance sheet with groups
Through Enhanced Balance Sheet with groups you may select to work with values subdivided by column per period. In this way you can see the evolution of liquidity by day, week, month, quarter, semester, year, etc.
- In Columns section indicate that you wish to view the Budget values.
- In Sections you can select the accounts or groups you want to include in the printout.
You may select to display the asset and depreciation accounts only. - Set up the Period.
If a period that exceeds the accounting period, is indicated, the program will automatically switch to budgeting over several years. - Indicate the subdivision by period required.
- If you think you're use this print setting again, create a Composition.
Accounting Report
The Accounting Report is similar to the one for Enhanced balance sheet with groups, with the difference that the display takes place in the Accounts table in columns.
You can therefore use it to get an instant view of the evolution of liquidity accounts.

Financial forecasting for suppliers
Supplier forecasting completes financial planning with supplier data. For exa, a company can plan purchases by indicating purchases by indicating accounts for the most important suppliers. It will thus be able to analyze and optimize the relationship with the various suppliers, perhaps by requesting payment extensions.
Forecasting with the double entry method also allows you to indicate accounts for individual suppliers. Depending on the need, suppliers management can be done with balance sheet accounts, profit and accounts or with cost and profit centers.
When changing a budget movement, the forecasts for each individual supplier are also updated.
Accounts table
Set up accounts for suppliers in the Accounts table. In the Estimate column you will also have the updated forecast balances for the accounting period. At a glance you can know what the forecast for the individual supplier will be.

Evolution chart
If you view the Graphs window, positioning the cursor on an account or a group you will see the graph for the evolution of the suppliers.
If you click on the Current, Previous or Estimate legend, you can hide the graph.
Account card with estimate data
With the Account card command you have the possibility to see in detail all the movements for each supplier.

- Select budget movements.
- Indicates the supplier’s account.
- Set up the period.
If you indicate a period that extends beyond the accounting period, the program will automatically generate Forecasts over several years. - When indicating a group, you will see the movements of all the accounts belonging to that group.
- When in the Budget table, you can access the customer's card with a click on the small icon next to the account number.
Enhanced Balance sheet with groups
Through Enhanced Balance Sheet with groups you may select to work with values subdivided by column per period. In this way you can see the evolution of liquidity by day, week, month, quarter, semester, year, etc.
- In Columns section indicate that you wish to view the Budget values.
- In Sections you can select the accounts or groups you want to include in the printout.
You may select to display the asset and depreciation accounts only. - Set up the Period.
If a period that exceeds the accounting period, is indicated, the program will automatically switch to budgeting over several years. - Indicate the subdivision by period required.
- If you think you're use this print setting again, create a Composition.
Accounting Report
The Accounting Report is similar to the one for Enhanced balance sheet with groups, with the difference that the display takes place in the Accounts table in columns.
You can therefore use it to get an instant view of the evolution of liquidity accounts.

Investments Planning
The investment plan presents the expected evolution of the equipment, stocks, movable or immovable values that are necessary for the company.
With Banana Accounting, thanks to the forecasting with the double-entry method, you can track what the evolution of assets will be over time. You generate comprehensive forecasts, which you can organize in different ways. The program also calculates forecasts over several years.
The structure of the accounts is identical to the one used for accounting. When printing, you can indicate whether to select which values to display, the final ones only, the forecasted ones or both together.
You also have the Income statement forecasts, so you can display the evolution of amortization and interest. When a budget movement is changed, the forecasts are immediately updated. You can run simulations, assign a payment, add an investment, change sales and see how asset accounts evolve.
For the Investment Plan, you have the same options as in the Liquidity Planing and the Provisional Profit and Loss Account.
Using formulas
The formulas allow you to automate calculation of depreciation and interest. When you increase an investment, the Income statement will also be instantly be updated. Formulas are particularly useful when making forecasts over multiple years.
Chart of Accounts
In the Budget column of the Chart of Accounts the forecast values for all accounts and balance groups are displayed, and therefore, for all those relating to investments equally. With a glance, you have an instant view of the values referring to the accounting period.

If you require more investment details, you may add accounts or groups.
Evolution graphs
If you view the Graphs window, positioning the cursor on an account or a group you will have the graph of the evolution of the investments.
If you click on the Current, Previous or Estimate caption, you can hide the graph.
Account card with estimate data
Using the Account card command, will offer you the possibility to see in detail, day by day, the evolution for each asset and the depreciation accounts. You can check all the movements that have an impact on investments.
The Account card command allows you to specify if you want to see current or budgeted movements.

- Select budget movements.
- Set the period
If you indicate a period that exceeds the accounting period, the program will automatically generate Forecasts over several years. - If you indicate a group, you will see the movements of all the accounts belonging to that group.
- When you are in the Budget table, you can access the account card with a click on the small icon next to the account.
Enhanced Balance sheet with groups
Through Enhanced Balance Sheet with groups you may select to work with values subdivided by column per period. In this way you can see the evolution of liquidity by day, week, month, quarter, semester, year, etc.
- In Columns section indicate that you wish to view the Budget values.
- In Sections you can select the accounts or groups you want to include in the printout.
You may select to display the asset and depreciation accounts only. - Set up the Period.
If a period that exceeds the accounting period, is indicated, the program will automatically switch to budgeting over several years. - Indicate the subdivision by period required.
- If you think you're use this print setting again, create a Composition.

Accounting Report
The Accounting Report is similar to the one for Enhanced balance sheet with groups, with the difference that the display takes place in the Accounts table in columns.
You can therefore use it to get an instant view of the evolution of liquidity accounts.

Corporate financing plan
The corporate financing plan presents the expected evolution of the accounts relative to the origin of third party and own capital.
With Banana Accounting, thanks to the forecasting with the double-entry method, you can track what the evolution of assets will be over time. You generate comprehensive forecasts, which you can organize in different ways. The program also calculates forecasts over several years.
The structure of the accounts is identical to the one used for accounting. When printing, you can indicate whether to select which values to display, the final ones only, the forecasted ones or both together.
Income statement forecasts are also available, so you can display the evolution of depreciation and interest. When a budget movement is changed, the forecasts are immediately updated. You can run simulations, assign a payment, add an investment, change sales and see how asset accounts evolve.
For the Investment Plan, you have the same options as for the Liquidity Planing and the Provisional Profit and Loss Account.
Using formulas
The formulas allow you to automate calculation of depreciation and interest. When you increase an investment, the income statement will also be instantly be updated. Formulas are particularly useful when making forecasts over multiple years.
Chart of Accounts
In the Budget column of the Chart of Accounts the forecast values for all accounts and balance groups are displayed, and therefore, also for all those relating to investments. With a glance you get an instant view of the values referring to the accounting period.

If you require more investment details, you may add accounts or groups.
Evolution graphs
If you view the Graphs window, positioning the cursor on an account or a group you will see the graph of the evolution of the corporate finances
If you click on the Current, Previous or Estimate caption, you can hide the graph.
Account card with estimate data
Using Account card command you have the opportunity to see in detail, day by day, The evolution for each asset and on the depreciation accounts. You can see all the movements that have an impact on investments.
The Account card command allows you to specify if you want to see current or budgeted movements.

- Select budget movements.
- Set the period
If you indicate a period that exceed the accounting period, the program will automatically generate Forecasts over several years. - If you indicate a group, you will see the movements of all the accounts belonging to that group.
- When you are in the Budget table, you can access the account card with a click on the icon next to the account.
Enhanced Balance sheet with groups
Through Enhanced Balance Sheet with groups you may select to work with values subdivided by column per period. In this way you can see the evolution of liquidity by day, week, month, quarter, semester, year, etc.
- In Columns section indicate that you wish to view the Budget values.
- In Sections you can select the accounts or groups you want to include in the printout.
You may select to display the asset and depreciation accounts only. - Set up the Period.
If a period that exceeds the accounting period, is indicated, the program will automatically switch to budgeting over several years. - Indicate the subdivision by period required.
- If you think you're use this print setting again, create a Composition.
Accounting Report
The Accounting Report is similar to the one for Enhanced balance sheet with groups, with the difference that the display takes place in the Accounts table in columns.
You can therefore use it to get an instant view of the evolution of liquidity accounts.

Project planning with profit and cost centres
Financial planning of projects allows you to take control over the income and expenses of a project. It is used to evaluate investments and returns on a project and to track its implementation.
Budgeting with the double-entry method allows you to indicate profit and cost centres as well. You only need to set up cost centers for the different projects, and in parallel to the balance and income statement forecasts, you will have the forecasts available for each individual project.
The projections are calculated on the basis of the initial balance and the forecasts entered in the Budget table. When a line is changed the budget, forecasts are instantly updated. You can produce simulations, reassign a payment, add an investment, modify sales and spot how the budget changes.
Values of liquidity can be displayed in several ways.
Chart of Accounts
Profit and Cost centres are set up in the Chart of Accounts. In the Estimate column you will also have the updated forecast balances for the accounting period. At a glance you can know what the liquidity situation will be at the end of the year.

Evolution chart
In the Graphs view window, position the cursor on an account or a group and a graph of the evolution of the projects will be displayed.
Clicking on the Current, Previous or Estimate legend, you can hide the graph.
Account card with budget data
With the Account card command you have the possibility to display all the movements for the single project in detail.

- Select budget movements.
- Indicate the cost or profit center.
- Set the period.
If you indicate a period that extends beyond the accounting period, the program will automatically switch to Forecasts over several years. - When you indicate a group, you will see the movements of all the accounts belonging to that group.
- When in the Budget table, you can access the cost center tab by clicking on the small icon next to the account number.
Enhanced Balance sheet with groups
With the Enhanced Balance sheet with groups you choose to divide the values into separate columns for each segment. Thus, you dispose of a view of the evolution of individual projects by day, week, month, trimester, semester, year etc..
- Indicate that you wish to display the Budget values in the Columns section.
- In Sections you may choose to view the the cost and profit centres only.
- Set up the Period.
If you indicate a period that extends beyond the accounting period, the program will automatically switch to Forecasts over several years. - Indicate the required subdivision by segments.
- If you think of continuing to use this print setting, create a composition.

Accounting report
The Accounting report is similar to the Enhanced balance sheet with groups, with the difference, that the display takes place in columns.
It can therefore be used to display an instant view of the evolution of the segments.

Planning with segments per sector and branch
The financial planning by sectors allows you to run budget and income statement forecasts for each sector or branch of the company. It therefore allows you to evaluate the various sectors of the company and understand what contribution each of them brings to the overall activity.
Budgeting with the double-entry method permits you to designate segments as well. When you set the segments for the different sectors, use them when you enter the budget movements and the budget and income statement forecasts will be made available, divided by the different sectors.
The projections are calculated on the basis of the initial balance and the forecasts entered in the Budget table. When a line in the budget is changed , forecasts are instantly updated. You can produce simulations, reassign a payment, add an investment, modify sales and spot how the budget changes.
Values of liquidity can be displayed in several ways.
Chart of Accounts
Segments are set up in the Chart of Accounts. When indicating the segments for the Balance Sheet and Income statement accounts, the balance of the segment will always result as zero in the accounts.

Account card with budget data
With the Account/Category cards command you have the possibility to examine all the movements for each segment in detail.
- Select budget movements
- Indicate the required segment.
- Set the period.
If you indicate a period that extends beyond the accounting period, the program will automatically switch to Forecasts over several years. - If you indicate a group, you will see the movements of all the segments belonging to that group.
- When you are logged in the Budget table, you can access the cost center tab with a click on the small icon next to the account number.

Enhanced Balance sheet with groups
With the Enhanced Balance sheet with groups you choose to divide the values into separate columns for each segment. Thus, you dispose of the Balance Sheet and Income statement for each sector.
- Indicate that you wish to display the Budget values in the Columns section.
- In Sections you may choose to view the balance sheet or income statement only.
- Set up the Period.
If you indicate a period that extends beyond the accounting period, the program will automatically switch to Forecasts over several years. - Indicate the required subdivision by segments.
- If you think of continuing to use this print setting, create a composition.

Accounting report
The Accounting report is similar to the Enhanced balance sheet with groups, with the difference that, the display takes place in columns.
It can therefore be used to display an instant view of the evolution of the segments.

New year for financial forecasting
The function to Create a New Year also takes up the budget movements.
For each row in the table Budget, in the For New Year column, you have the possibility to indicate:
- Whether the operation is to be copied over or not,
- If the date is to be kept or replaced with the date of the new year.
Creating the budget for the new year is therefore simple, because you have to modify or add the expense and income items that are expected to change.
Einfaches Jahresbudget
Wird ein Budget mit Einnahmen und Ausgaben für jedes Konto gewünscht, ist NICHT die Tabelle 'Budget' hinzuzufügen, sondern es wird die Spalte Budget der Tabelle Konten bzw. Kategorie benutzt.
Nur wenn es keine Budget-Tabelle gibt (bei Vorhandensein, kann sie entfernt werden), kann die Spalte Budget in der Tabelle Konten bzw. Kategorien bearbeitet werden und dient zur Eingabe der Budgetwerte für jedes einzelne Konto bzw. Kategorie. Der eingegebene Betrag bezieht sich auf die Abrechnungsperiode (Buchhaltungsjahr).
In der Regel wird nur für Ausgaben und Einnahmen ein Budget angegeben.
Die Budgetwerte müssen einzeln eingegeben werden. Das Programm berechnet die Summen automatisch, sowie den Gewinn oder Verlust.
- In der doppelten Buchhaltung müssen in der Tabelle Konten die Erträge (Haben) als negativ und die Kosten (Soll) als positiv eingegeben werden.
- In der Einnahmen-Ausgaben-Rechnung bzw. Kassenbuch müssen in der Tabelle Kategorien die Erträge als positiv und die Kosten als negativ ausgewiesen werden.
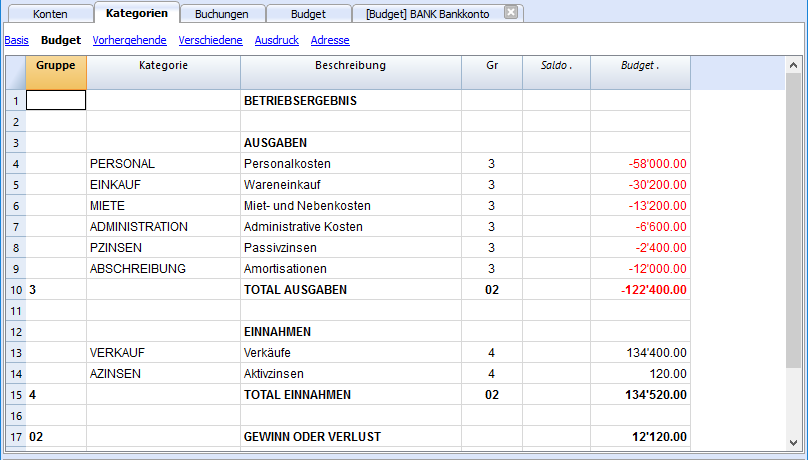
Spalte 'Diff. Budget'
In der Spalte Diff Budget berechnet das Programm die Differenz zwischen dem Saldo und dem in der Spalte Budget angegebenen Wert.
Ausdrucke nach Periode
Beim Drucken nach Monat oder Quartal unterteilt das Programm den in der Spalte Budget angegebenen Wert in Monatsanteile.
Das Programm unterteilt wie folgt:
- Berechnet die Anzahl der Monate aufgrund des in den Eigenschaften - Stammdaten der Buchhaltung (Menü Datei) angegebenen Anfangs- und Enddatum.
- Teilt den Budgetbetrag durch die berechneten Anzahlen von Monaten.
- Eventuelle Rundungsdifferenzen werden dem letzten Monat angerechnet.
Wenn Sie einen Betrag von 10'000 angegeben haben, wird dieser in 11 Monatsraten, von 833.33 und eine Monatsrate von 833.37 aufgeteilt.
Wenn das Anzeigen nach Quartal gewählt wird, ist der Wert des Quartals die Summe der einzelnen Monate und nicht der Jahreswert unterteilt durch die Quartale.
Wenn Sie eine andere Planung nach Monat oder Quartal wünschen, sollten Sie für die Finanzplanung die Budget-Tabelle verwenden.