In this article
A complete guide to building, installing and using a personal dashboard for Banana Accounting Plus with Claude or ChatGPT. No programming knowledge needed.
1. Overview
You describe what you want in a chat. The AI writes the extension. You install it in Banana and use it.
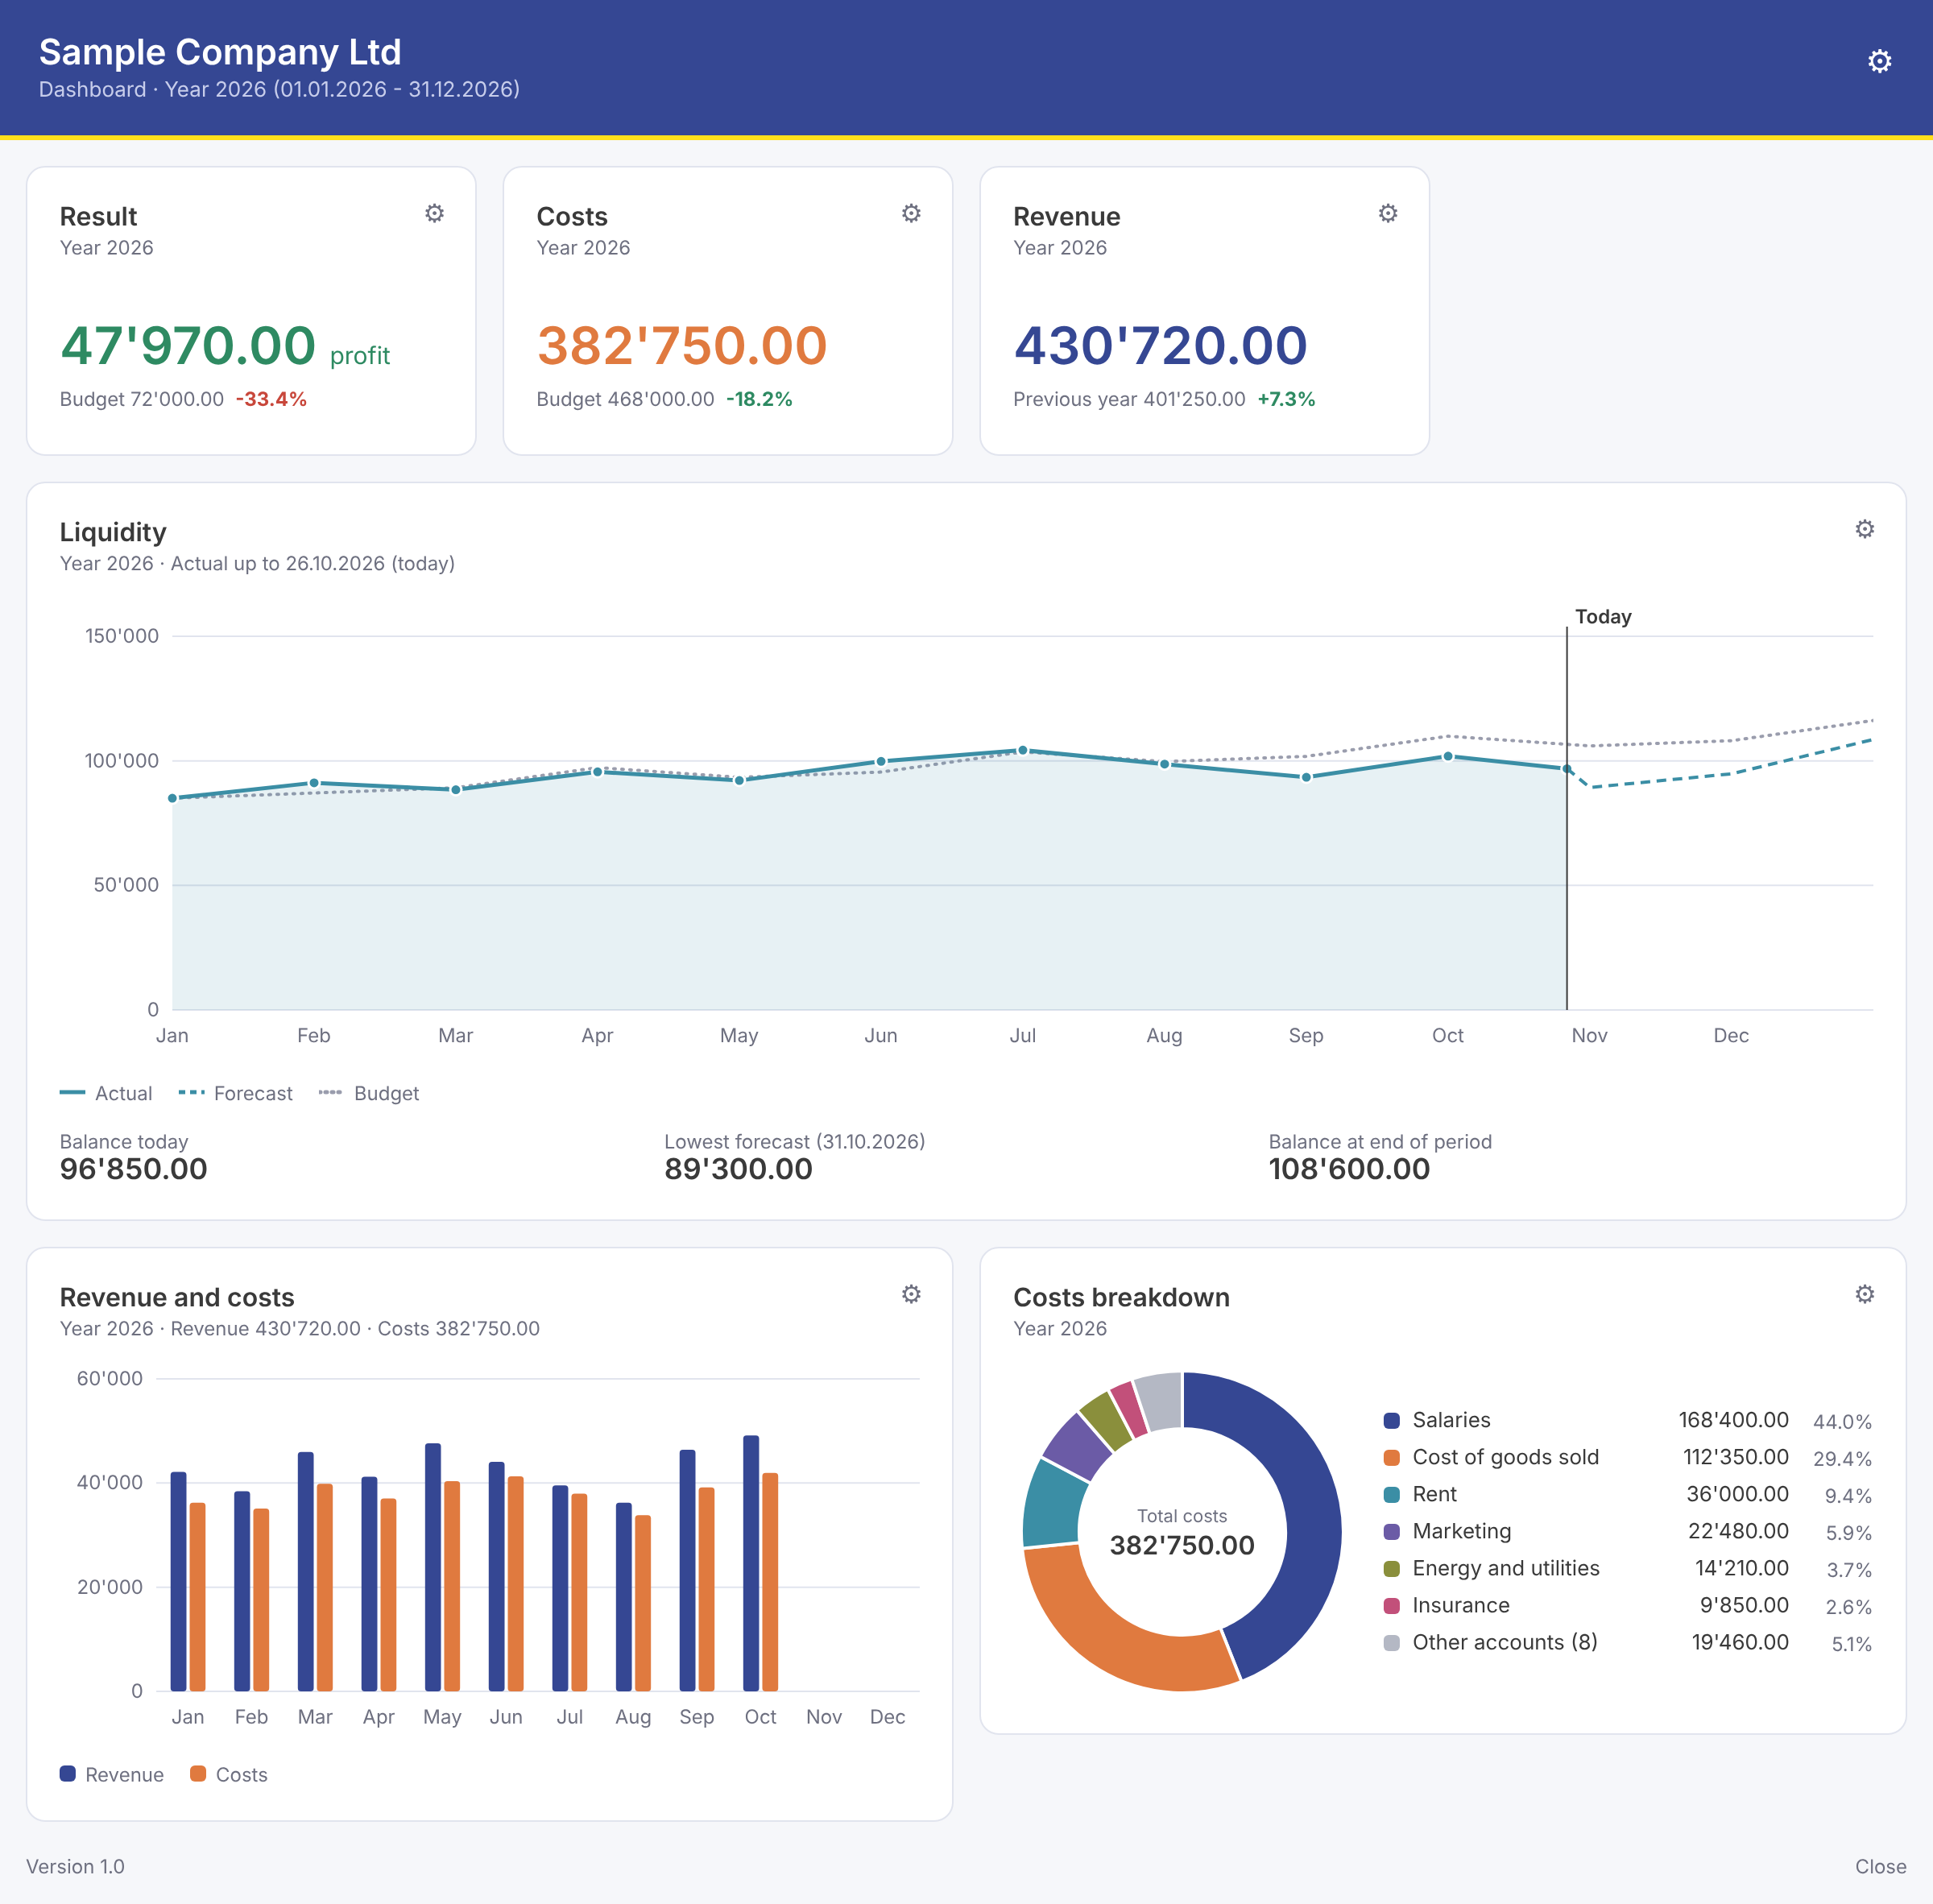
Example of a dashboard generated with the skill.
The Banana dashboard is an extension for Banana Accounting Plus. It opens a window that shows the most important data of your accounting file: profit or loss, costs, revenue, liquidity, budget comparison, breakdowns and lists.
An advanced report
The dashboard is a form of advanced reporting for your accounting. Like the other reports of Banana Accounting Plus, it runs inside Banana with an accounting file open and presents the data of that file.
What makes it different is the presentation: indicators, charts and lists on one screen, with the period and the details you choose. With the AI you simply put together the report that shows the data you want to follow, in the way that is clearest for you.
You do not write any code. You use a set of instruction files, called a skill, together with an AI assistant (Claude or ChatGPT). The skill tells the AI exactly how a Banana dashboard must be built and how every widget must look. You only choose which widgets you want.
Your accounting data stays with you. You never need to share your accounting file or any of its data with the AI. The AI only writes the code of the extension; the data are read by Banana on your computer when you run the dashboard. Just keep in mind that a screenshot you add to the chat shows the AI what is visible in it.
- Choose: in the chat, the AI shows you the list of widgets. You pick the ones you want.
- Install: the AI gives you a zip file. You unzip it, create the extension package in Banana and install it.
- Use: you run the dashboard, choose the period and the colors, and adjust each widget with its settings button.
Important: the dashboard is written by an AI assistant. The code is generated for you and is not provided, checked or guaranteed by Banana.ch SA. Test it first on a copy of your accounting file and check that the data are correct. The dashboard only reads your accounting data and never changes it.
2. Prerequisites
To use the generated dashboard extension you need:
- The Banana Accounting+ Dev Channel version and the Advanced plan.
What else you need
- A double-entry accounting file. The opening and closing dates must be set in the file properties.
- An AI account. Claude (claude.ai) or ChatGPT (chatgpt.com), with access to Projects. A paid plan is recommended: the work is long and uses the larger models.
- The skill. The folder
banana-dashboardwithSKILL.mdand thewidgetsfolder (12 files in total), or the filebanana-dashboard.zip. - Optional: a budget (Budget column of the Accounts table, or Budget table) for the budget widgets and the liquidity forecast, and the previous year file linked in the file properties for comparisons with the previous year.
Download the skill
The zip contains the folder banana-dashboard with SKILL.md (1 file) and the widgets folder (12 files). For a Claude or ChatGPT project, unzip it and upload the 13 files. To add it as a skill in Claude, upload the zip as it is.
3. The skill files
Plain text files with instructions for the AI. You do not need to read or change them.
banana-dashboard/
├── SKILL.md                      general instructions
└── widgets/                      one sheet per widget
    ├── result-indicator.md
    ├── costs-indicator.md
    ├── revenue-indicator.md
    ├── liquidity-evolution.md
    ├── revenue-costs-bars.md
    ├── cumulative-result.md
    ├── costs-breakdown.md
    ├── revenue-breakdown.md
    ├── budget-comparison.md
    ├── costs-list.md
    ├── revenue-list.md
    └── transactions-list.md
The files end in .md (Markdown): simple text with titles, lists and tables, easy for an AI to read. They contain no program code: they describe in words what the AI must build and the rules it must follow. The AI writes all the code for you.
SKILL.md – the general instructions
The main file. It tells the AI:
- how to talk to you: in your language, in plain words, showing the notice of section 1 at the start;
- the guided path: propose the widgets, wait for your choice and confirmation, build, check, deliver, fix;
- the structure of the extension: which files to create and what each one does;
- the rules learned from Banana, so that the extension starts without errors;
- the parameters: period, color palettes, widget settings and how they are saved;
- the Banana functions to use and the links to the official Banana and Qt documentation;
- the appearance: fonts, spacing, chart style, legends, so that every dashboard looks finished;
- a checklist the AI goes through before every delivery, and a table of common problems and solutions.
The widget files
One file per widget. Each describes the widget completely: what it calculates, how it is drawn, which settings it has and their default values, and which message it shows when data is missing. This way every widget is always built the same way, whoever asks for it and whichever AI builds it, and you never have to explain what a chart should contain.
Why so many rules? The AI cannot run Banana: it writes the code without being able to test it. The rules and the checklist prevent the most common mistakes, and a safety mechanism makes sure that if something still goes wrong, the dashboard shows you the exact error instead of not opening at all (see section 11).
4. Set up Claude
Do this once. Then you can create and change dashboards in as many chats as you want.
Option A – A Project (recommended)
A Project keeps the skill files and the instructions together, so every chat in the project already knows them.
- Download and unzip the skill.
- Go to claude.ai and sign in.
- In the left panel click Projects, then + New Project. Name it, for example, Banana Dashboard.
- In the project, on the right, click + next to the project knowledge and upload
SKILL.mdand all the files of thewidgetsfolder (you can select them all at once). The name of your folder does not matter: the AI finds the widget files by their name. - Click Set project instructions, paste the text below and click Save instructions.
- Open a new chat inside the project and continue with section 7.
Project instructions to paste:
Follow the instructions in SKILL.md to create, change or fix a dashboard extension for Banana Accounting Plus. The widget files are the other .md files of this project, listed in section 8 of SKILL.md. Always answer in my language.Option B – As a skill
A skill is available in all your chats, not only in one project. Claude uses it automatically when you ask for a Banana dashboard.
- Make sure Code execution and file creation is enabled in the Claude settings (required for skills).
- Open Settings › Customize › Skills, click + and choose Upload a skill.
- Select
banana-dashboard.zip. Do not rename the folder inside the zip: it must be calledbanana-dashboard. - Start a new chat and ask for a Banana dashboard.
Tip: menu names can change slightly over time and with the language of the interface. If you do not find them, see the Claude Help Center.
5. Set up ChatGPT
ChatGPT uses a Project with the same files.
- Go to chatgpt.com and sign in.
- In the left panel create a New project and name it, for example, Banana Dashboard.
- Add the files to the project:
SKILL.mdand all the files of thewidgetsfolder. If folders are not accepted, upload the files one by one or all together: the folder structure is not needed. - Open the project Instructions, paste the text below and save.
- Start a new chat inside the project and continue with section 7.
Project instructions to paste:
Follow the instructions in SKILL.md to create, change or fix a dashboard extension for Banana Accounting Plus. The widget files are the other .md files of this project, listed in section 8 of SKILL.md. Always answer in my language.Tip: the ChatGPT interface changes often. If a button has a different name, look for the project settings where you can add files and instructions, or see the OpenAI Help Center.
6. Which AI model to use
Larger models and more "thinking" make fewer mistakes on complex work, but are slower and use more of your plan limits.
- Claude, in general: Opus 5.5, thinking Medium.
- ChatGPT, in general: GPT-6, thinking High.
Claude in detail
| Configuration | When to use it |
|---|---|
| Haiku 4.5, low thinking | Small changes, texts, colors |
| Sonnet 5.5, medium thinking | Changes to a single widget |
| Opus 5.5, medium thinking | Creating the dashboard, fixing QML and JavaScript (main choice) |
| Opus 5.5, high thinking | Complex debugging, structure, code review |
ChatGPT in detail
| Configuration | When to use it |
|---|---|
| GPT-6 Instant | Small changes, texts, colors |
| GPT-6 Medium | Changes to a single widget |
| GPT-6 High | Creating the dashboard, fixing QML and JavaScript (main choice) |
| GPT-6 Extra High | Complex debugging, structure, code review |
Good to know:
- These are recommendations, not strict rules. Available models depend on your plan.
- You can switch model in the middle of a chat: create the dashboard with the main choice, then use a lighter model for small touches.
- If a small change made with a light model causes an error, ask again with the main choice.
7. Working in the chat
Write and describe what you want in your language. The AI guides you.
Start
Open a new chat in the project and write what you want, for example:
I would like to create a dashboard for my accounting file in Banana. I want to keep an eye on profit, costs and liquidity.What happens next
- Notice. The AI shows you the notice about generated code and testing on a copy.
- Your goal. It asks what you want to keep an eye on, and checks that you use double-entry accounting.
- The widgets. It shows the list of available widgets (see section 12), with the most suitable ones first.
- Title and name. It asks a title for the dashboard and a name for the extension (shown in the Banana Extensions menu).
- Confirmation. It repeats your choice and waits for your OK.
- Build and delivery. It writes all the files, goes through its checklist and gives you the result (section 8).
Example
You
I'd like a dashboard to follow profit and liquidity.
AI
Before we start: the dashboard is written by an AI… Here are the widgets that fit your goal: 1. Result (profit or loss), 2. Liquidity evolution, 3. Budget comparison… Which ones would you like?
You
1, 2 and 3, plus the costs breakdown. Title “My company”, extension name “My dashboard”.
AI
So: Result, Liquidity evolution, Budget comparison and Costs breakdown, title “My company”. Shall I build it?
You
Yes.
Tips:
- One request at a time works best: first the dashboard, then the changes.
- Stay in the same chat for changes to the same dashboard: the AI remembers what it built.
- To start again from scratch, open a new chat.
8. What the chat gives you
A zip file with a folder that contains the whole extension.
If the AI cannot create files, it gives you every file in a separate code block with its exact name: copy each one into a text file with that name, all in the same folder.
The folder contains these files (names may differ slightly):
| File | What it is |
|---|---|
ch.<company>.dashboard.js | The main file. It opens the dashboard and saves your settings. |
ch.<company>.dashboard.qrc | The package file: the list of all the files of the extension. You drag it onto Banana to create the extension package (.sbaa), the file you install. |
ch.<company>.dashboard.manifest.json | The manifest: name, description and version of the extension, shown in Manage Extensions. |
Dashboard.qml | The container: a small, always identical window that loads everything else and shows any error clearly. |
Content.qml | The dashboard itself: header, settings, the grid with the widgets. |
data.js | All the calculations: reads the data from your accounting file. |
Style.qml, qmldir | Colors, fonts and sizes, and the color palettes. qmldir is a small technical file needed by Style.qml. |
Widget.qml | The frame shared by all widgets: card, title, settings button. |
…Widget.qml | One file per widget you chose, e.g. LiquidityWidget.qml. |
SettingsPanel.qml, PeriodPicker.qml, AccountPicker.qml | The settings panels and their controls (period choice, account choice). |
The AI also gives you the installation steps and asks you to test and tell it what you see.
Keep the files together: all the files must stay in the same folder. Do not rename them and do not move single files elsewhere.
9. Install the extension
Once per dashboard. The extension is installed as a package (.sbaa file), which Banana creates from the files the AI gives you.
- Unzip the zip file into a folder of your choice that you will not delete, for example Documents > Banana extensions > My dashboard.
- Create the package: drag the
.qrcfile (for examplech.mycompany.dashboard.qrc) onto the Banana Accounting Plus window. Banana creates the packagech.mycompany.dashboard.sbaa. - Open your accounting file (better a copy for the first test).
- Open the menu Extensions > Manage Extensions, click Add from file and choose the
.sbaafile. - Grant the permissions: in the same window select the extension. Its Permissions status is Revoked: click Grant. The dashboard needs this permission to open its window.
- Close the window. The dashboard is now in the Extensions menu, with the name you chose.
Updating: when the AI gives you a new version, replace all the files in the folder with the new ones, drag the .qrc file onto Banana again to create the new package, then open Extensions > Manage Extensions and click Update extensions. If the footer still shows the old version number, remove the extension and add the .sbaa again.
10. Run the dashboard
From the Extensions menu, with an accounting file open.
- Open the accounting file and choose your dashboard in the Extensions menu.
First time: a panel asks you
- the period to show (the whole accounting year is preselected);
- the color palette: Banana, Graphite, Sage or Bordeaux.
Click the button to start.
- The dashboard appears with your widgets. Check the version in the footer: it must be the one the AI just delivered.
- To change the period or the colors, click Settings at the top right of the dashboard. To change a widget, click Settings at the top right of that widget.
- Close the dashboard with the Close button.
- Save the accounting file to keep your settings for the next time.
Your data is safe: the dashboard never changes your accounting data. Only its own settings (period, palette, widget settings) are stored in the accounting file, in a separate place reserved for extensions.
11. How the dashboard works
The container and the widgets
The dashboard is a large container: a window with a header (title, company, period and the Settings button), a grid of widgets and a footer with the version number. Each widget is an independent card that calculates and shows its own data.
If a widget has a problem, only that widget shows a red error message; all the others keep working. The message says exactly which file and which line are wrong, for example “Error in RevenueWidget.qml, line 42”. Select it, copy it and paste it in the chat: the AI knows what to fix.
The period
All widgets use the period of the dashboard, chosen with Settings at the top right:
- Year
The whole accounting period, from the opening to the closing date (default). - Semester 1 or 2
Six months, counted from the opening date. - Quarter 1-4
Three months, counted from the opening date. If your year starts on 1 April, the first quarter is April–June. - Month
One month of the accounting period. - From … to …
Any two dates within the accounting period.
The choice is stored as “Quarter 2”, “Month 3” and so on, so it remains valid in the file of the next year. Some widgets can use their own period instead (setting Period in their Settings panel).
The colors
Four palettes are available: Banana (blue and yellow), Graphite (neutral, teal accents), Sage (greens) and Bordeaux (wine red). Changing the palette recolors the whole dashboard at once. Each kind of data always has the same color in all widgets (e.g. revenue, costs, budget).
Widget settings
Widgets with settings have a Settings button. The panel opens over the dashboard; Apply saves the change and redraws that widget, Cancel discards it. The settings of each widget are listed in section 12.
Where the data come from
- Actual data: the balances of your accounts, read directly from the accounting file each time the dashboard opens or a setting changes.
- Budget: the Budget column of the Accounts table or the Budget table. The liquidity forecast needs the Budget table.
- Previous year: the file of the previous year, linked in the file properties.
- Charts show the months up to the month of the last transaction recorded in the file; later months have no data yet and are not drawn as zero.
12. The widgets
Twelve ready-made widgets. Each is always built the same way, from its widget file.
The images show fictitious data in the Banana palette; your dashboard shows your data, in your language and in the palette you choose. The width is given in columns of the dashboard grid (4 columns in total).
Result
File result-indicator.md · width 1 column
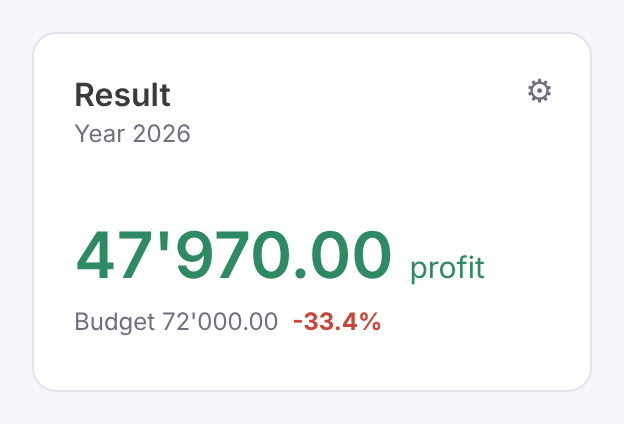
Shows: the profit or loss of the period (revenue minus costs) as a big number, green with the word “profit” or red with the word “loss”, and the comparison with the budget or the previous year.
Settings:
- Period: dashboard period or its own.
- Comparison: none, budget (default), previous year.
Costs
File costs-indicator.md · width 1 column
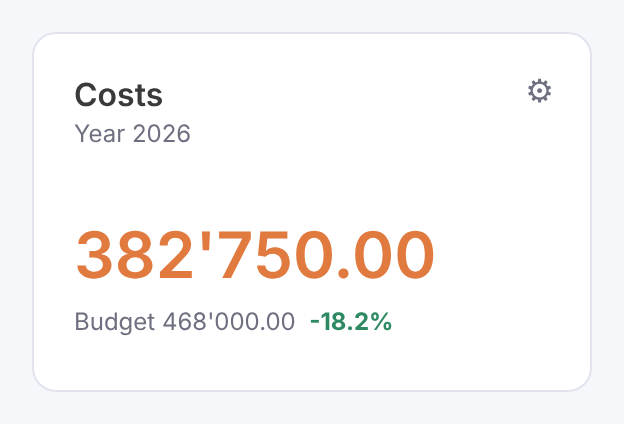
Shows: the total costs of the period. With a comparison, the budget or previous year and the variation in percent: green when costs are lower, red when higher.
Settings:
- Period.
- Comparison: none (default), budget, previous year.
Revenue
File revenue-indicator.md · width 1 column
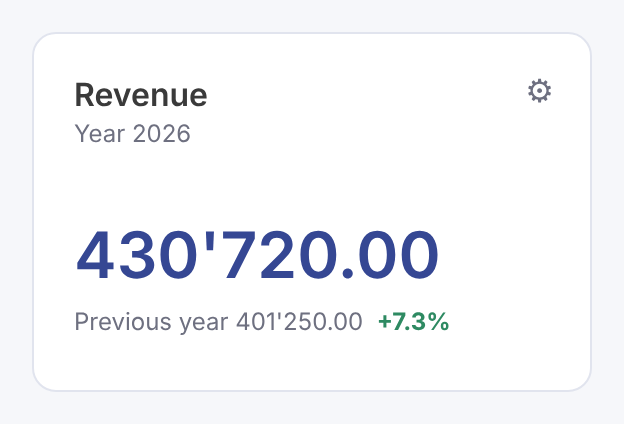
Shows: the total revenue of the period. With a comparison: green when revenue is higher, red when lower.
Settings:
- Period.
- Comparison: none (default), budget, previous year.
Liquidity evolution
File liquidity-evolution.md · width 4 columns
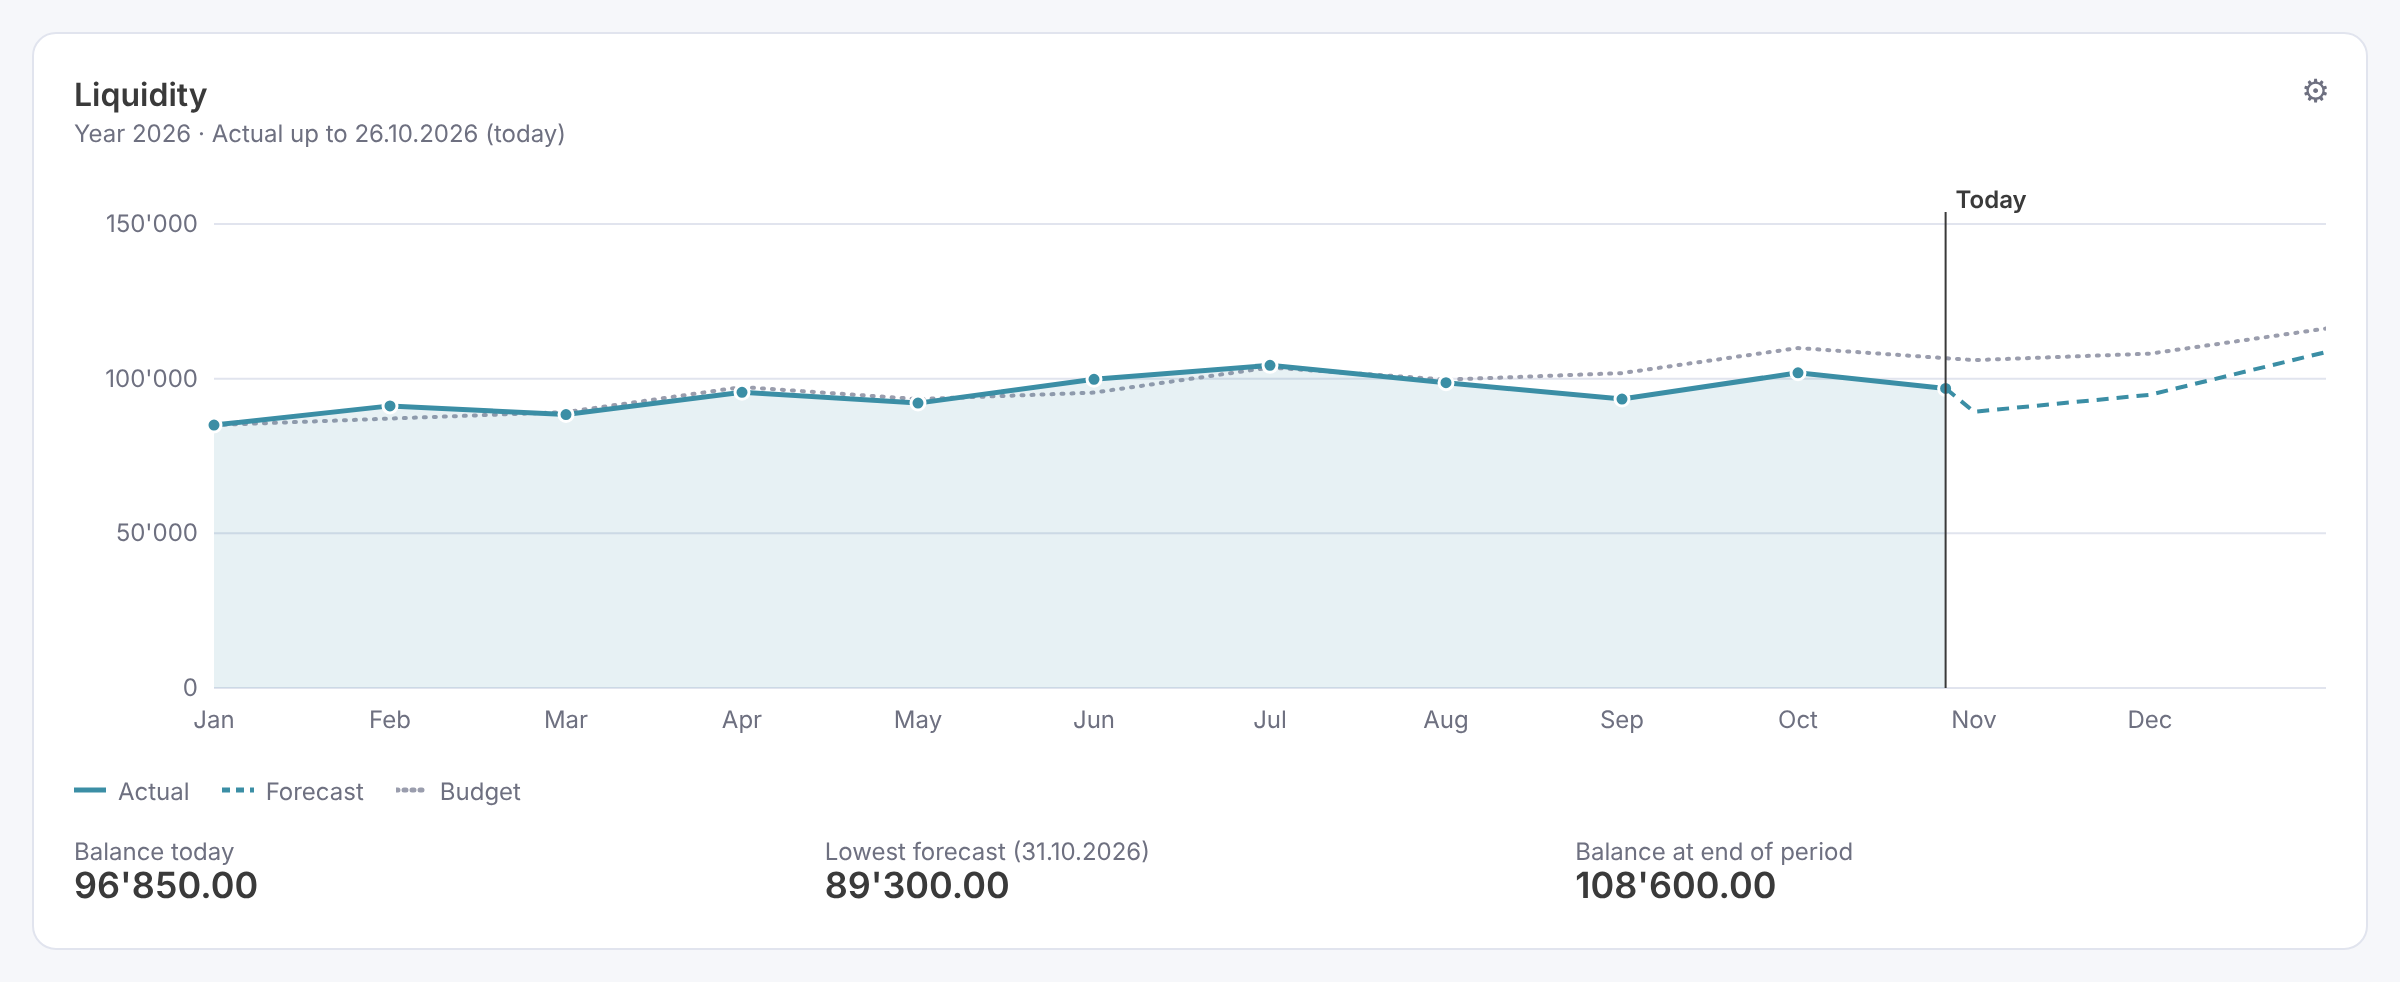
Shows: the balance of your cash and bank accounts through the period:
- solid line: actual balance up to today, with a light area underneath;
- dashed line: forecast from today on, from the Budget table;
- dotted line: the budget for the whole period;
- a vertical line marks today;
- under the chart: balance today, lowest forecast balance and its date, balance at the end of the period (in red when negative).
Settings:
- Accounts: choose your cash and bank accounts (or a group) from the list. Required: until you choose them, the widget asks you to.
- Actual up to: today (default), the date of the last transaction, or a date.
- Show the budget line: yes (default) or no.
- Period.
Tip: for a meaningful forecast, enter the planned movements of these accounts in the Budget table. Without them the forecast stays flat and the widget tells you so.
Revenue and costs per month
File revenue-costs-bars.md · width 2 columns
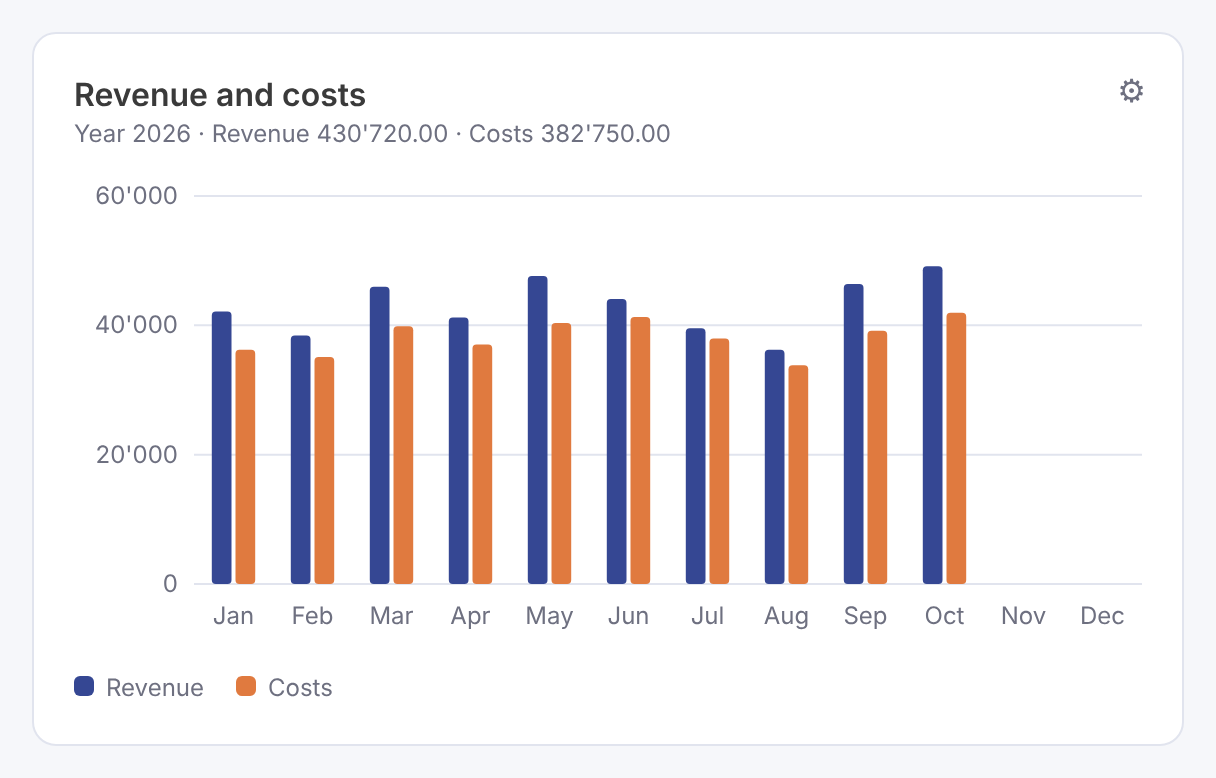
Shows: two bars for each month, revenue and costs, side by side, to compare them month by month. Months still to come or without transactions are empty.
Settings:
- Period.
Cumulative result
File cumulative-result.md · width 2 columns
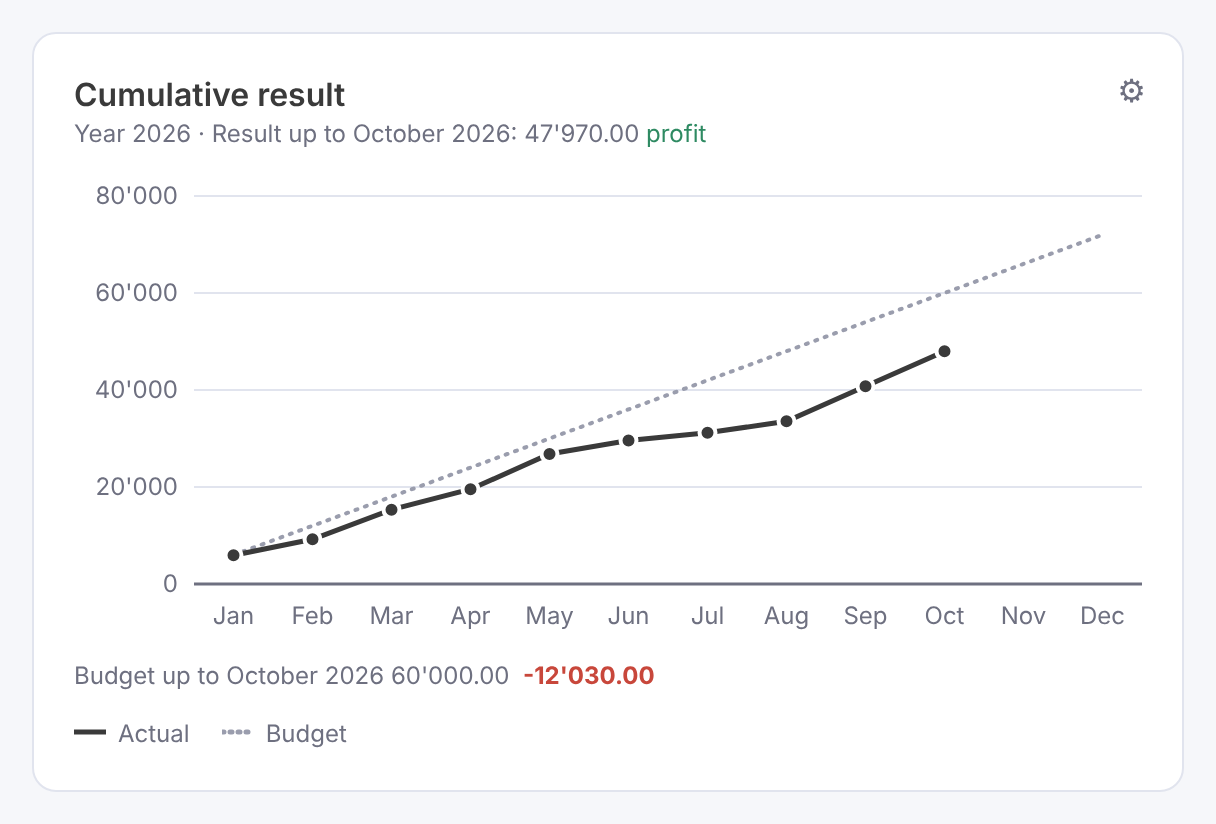
Shows: how the result (profit or loss) builds up month after month. The solid line adds up the result of each month up to the last transaction; the dotted line shows the budget (or the previous year) for the whole period, so you can see at a glance whether the year is on track. The line at zero marks the border between profit and loss. The subtitle shows the result to date, and under the chart you find the difference from the budget.
Settings:
- Period.
- Comparison: none, budget (default), previous year.
Costs breakdown
File costs-breakdown.md · width 2 columns
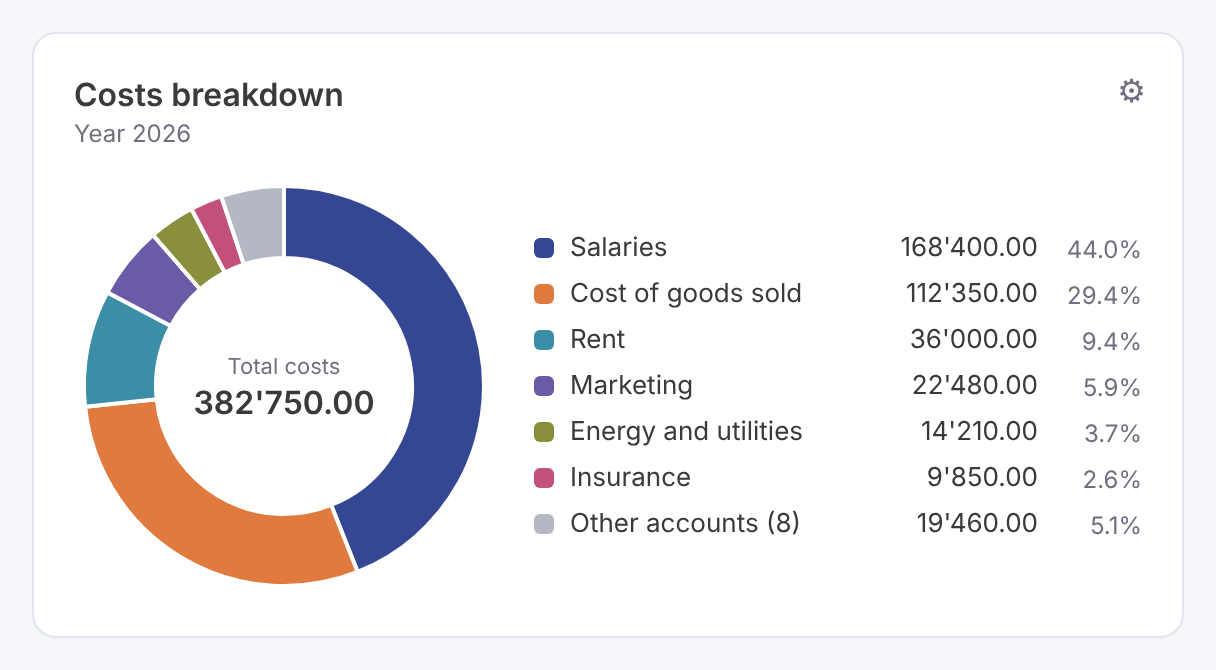
Shows: a ring chart with the share of each cost account of the total costs, the total in the middle and a legend with amounts and percentages. The smaller accounts are grouped as “Other accounts”.
Settings:
- Period.
- Number of slices: 3 to 10 (default 6).
Revenue breakdown
File revenue-breakdown.md · width 2 columns
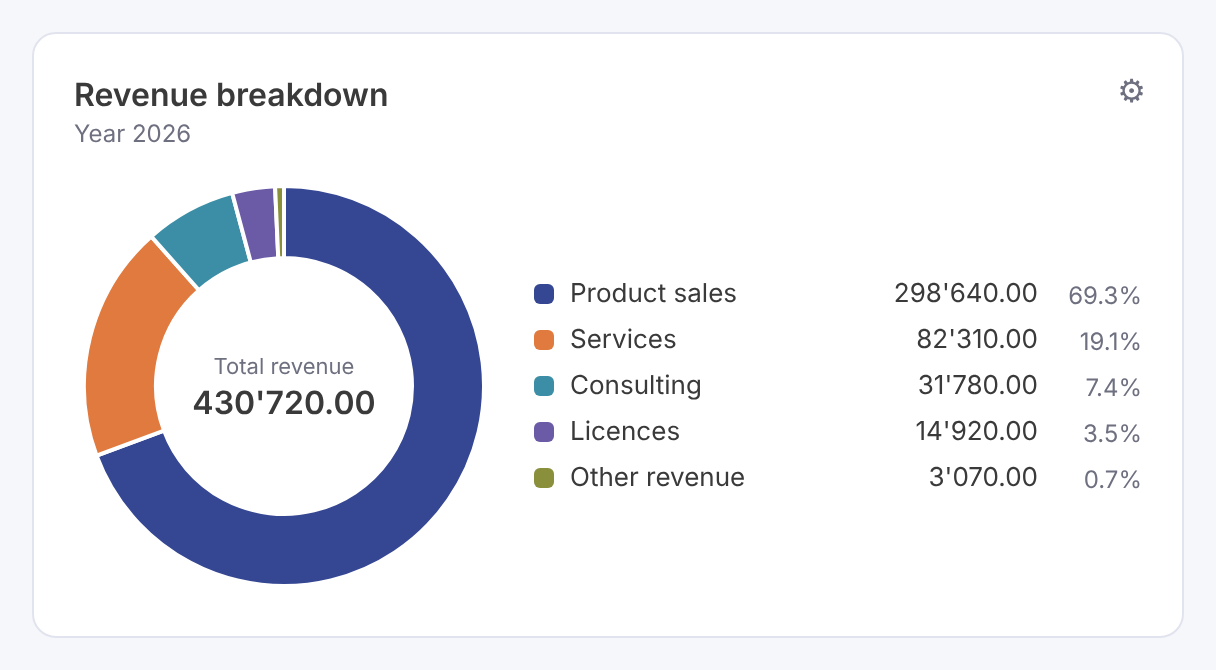
Shows: the share of each revenue account of the total revenue, with the total in the middle and the legend with amounts and percentages.
Settings:
- Period.
- Number of slices: 3 to 10 (default 6).
Budget comparison
File budget-comparison.md · width 2 columns
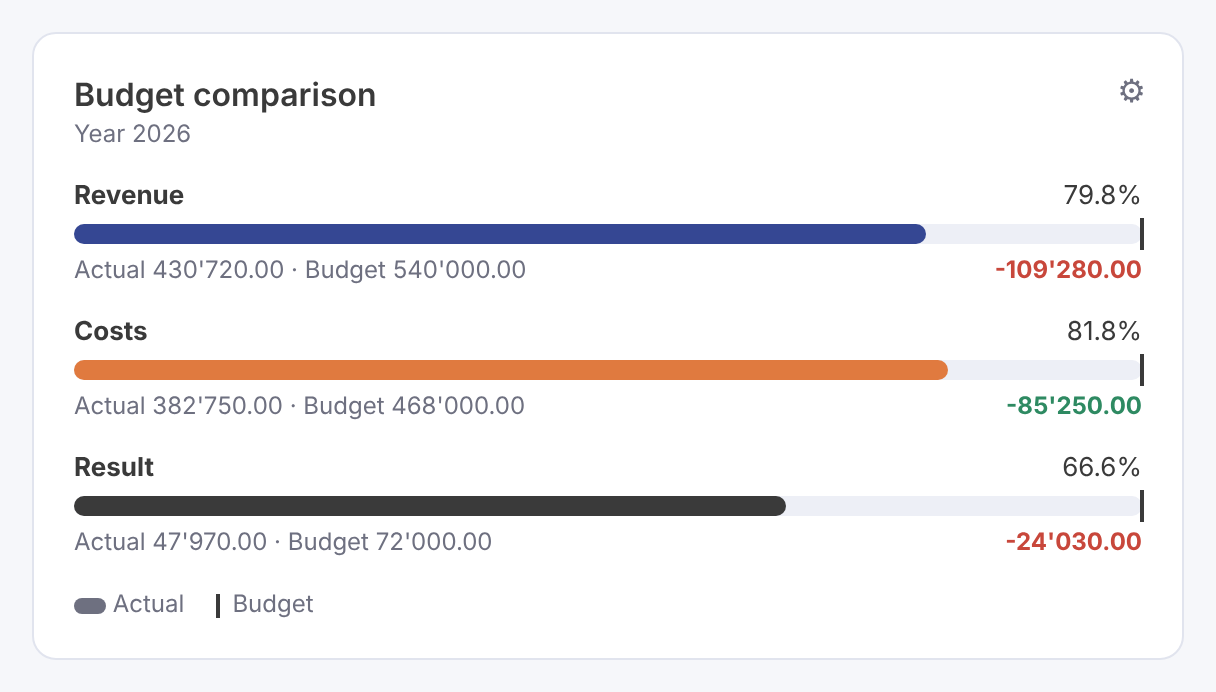
Shows: for revenue, costs and result, a bar with the actual amount, a marker at the budget, the percentage reached and the difference, green when better than the budget and red when worse.
Settings:
- Period.
Tip: needs a budget in the Accounts table (Budget column) or in the Budget table.
Largest costs
File costs-list.md · width 2 columns
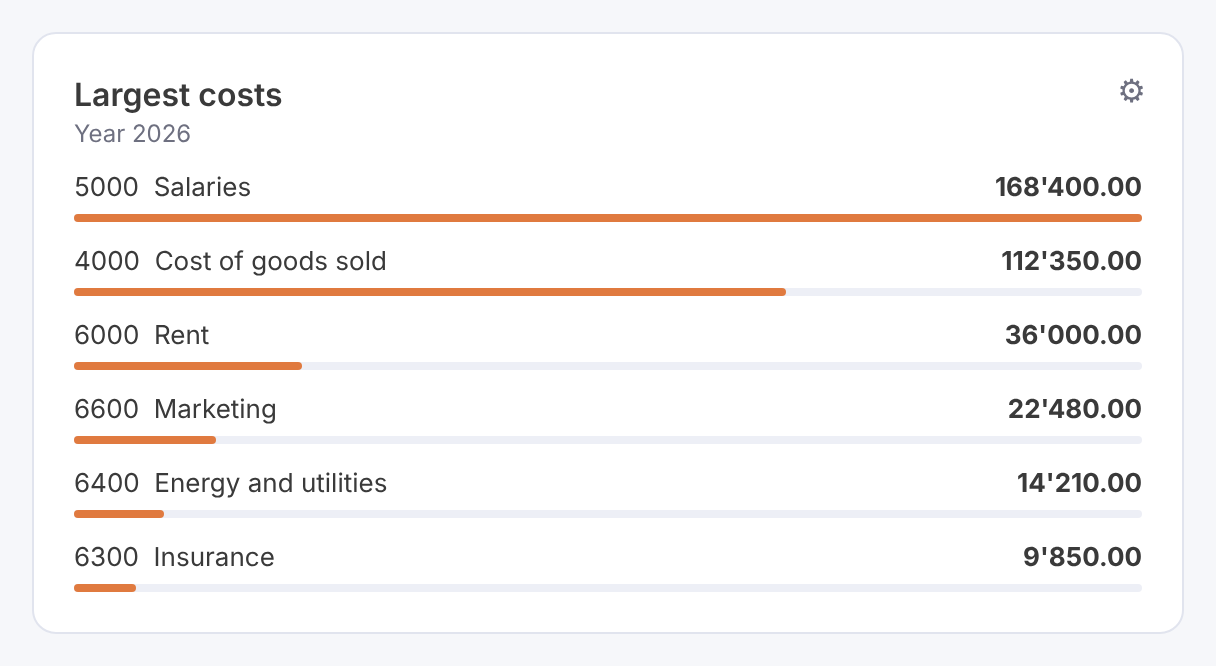
Shows: the cost accounts with the highest amounts of the period, from the largest, each with a thin bar proportional to the largest one.
Settings:
- Period.
- Number of accounts: 3 to 15 (default 6).
Largest revenue
File revenue-list.md · width 2 columns
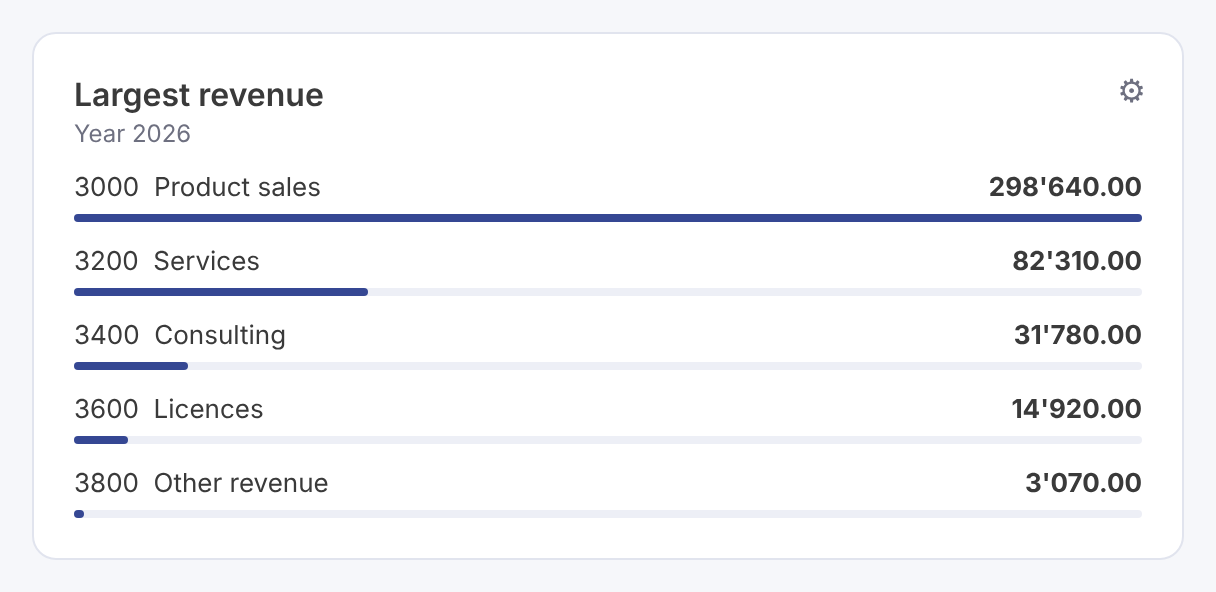
Shows: the revenue accounts with the highest amounts of the period, with proportional bars.
Settings:
- Period.
- Number of accounts: 3 to 15 (default 6).
Latest transactions
File transactions-list.md · width 4 columns
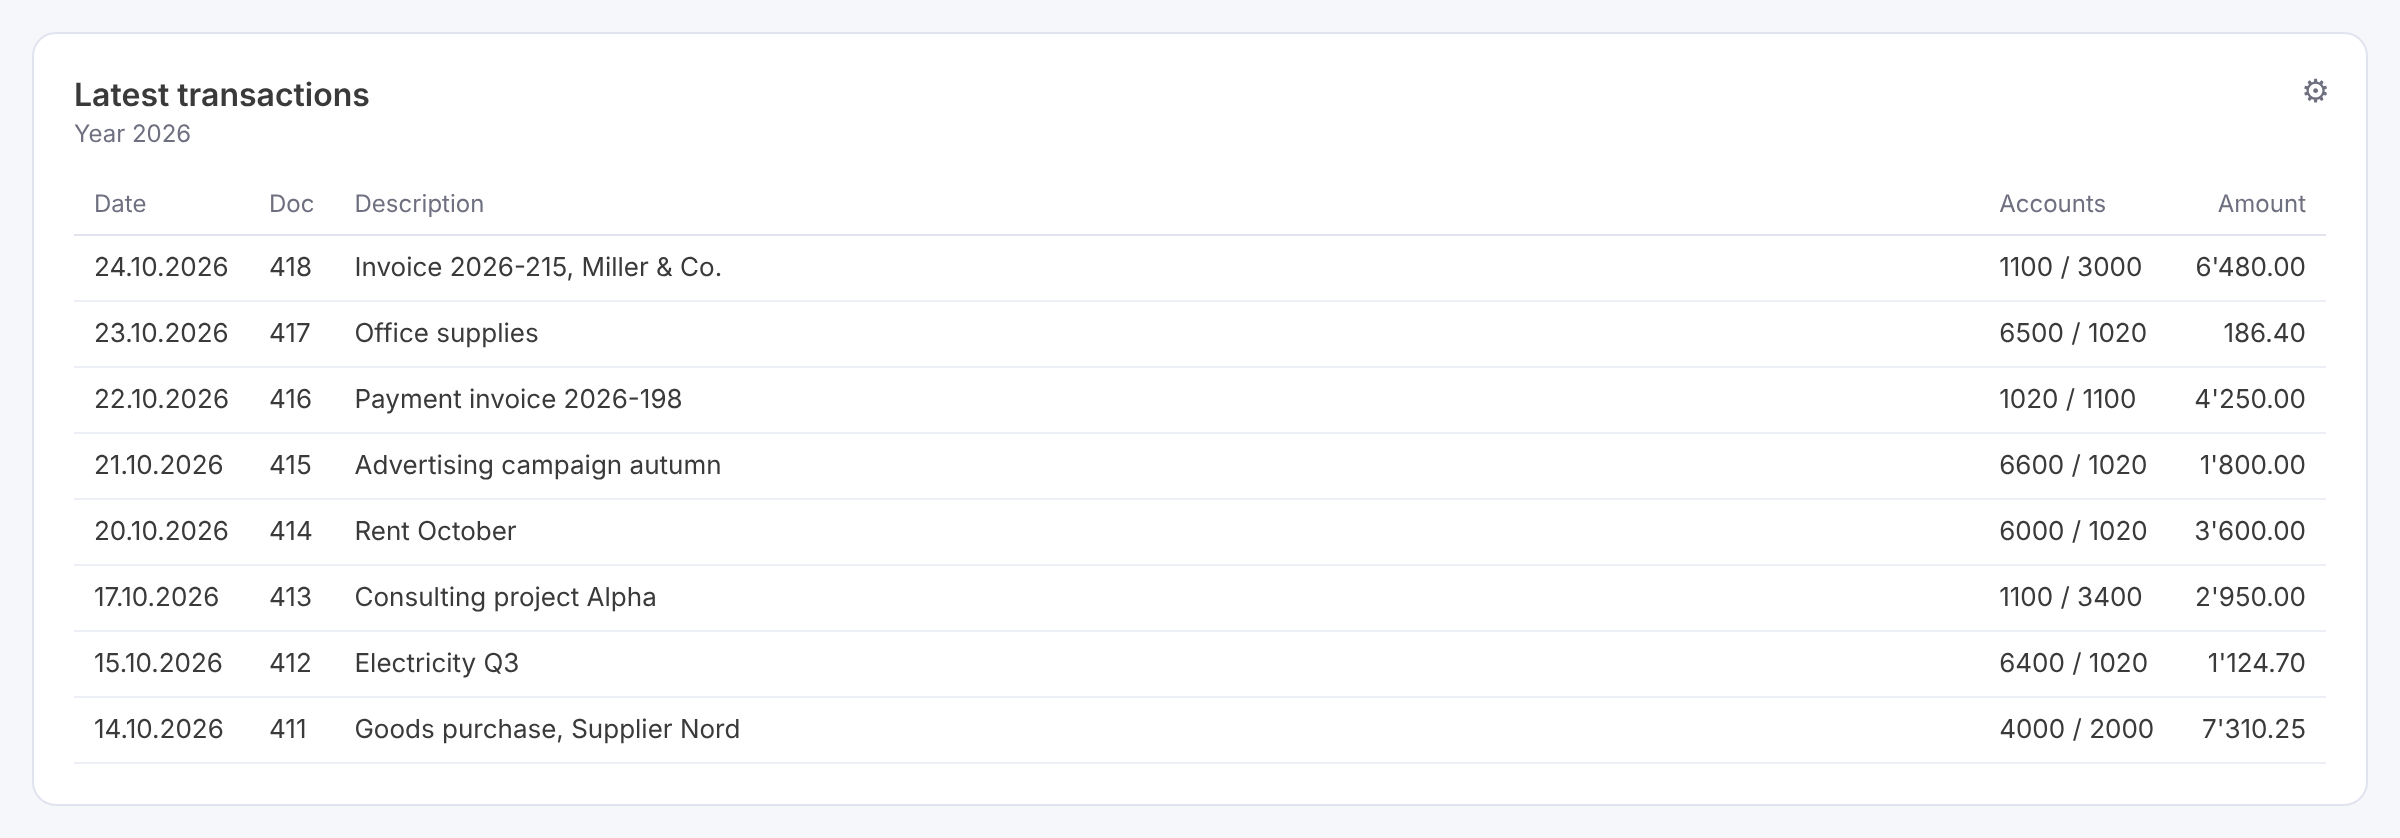
Shows: the last transactions recorded in the period, in a table with date, document, description, debit / credit accounts and amount.
Settings:
- Period.
- Number of transactions: 5 to 20 (default 8).
13. Changes and fixes
Just tell the AI. It changes the files and gives you a new version.
Something does not work
- Error message: select it, copy it and paste it in the chat.
- Wrong data or strange display: describe what you see and what you expected.
- Screenshot: take a picture of the dashboard and add it to the chat. The AI sees the image and fixes the problem. Just keep in mind that a screenshot you add to the chat shows the AI what is visible in it
You want something different
- “Make the titles bigger.”
- “Use darker colors for the charts.”
- “Add the costs breakdown widget.”
- “Remove the latest transactions.”
Changes to colors, sizes and spacing are made in Style.qml, so they apply to the whole dashboard, unless you ask for a single widget.
After each change
- Download the new zip, replace all the files in the extension folder and drag the
.qrcfile onto Banana again to create the new package; then update the extensions (section 9). - Close and reopen the dashboard.
- Check that the footer shows the new version number.
- Tell the AI whether it works.
If it is not fixed at the first attempt: insist. Say what is still wrong, add the new error message or a new screenshot. Complex problems sometimes need two or three rounds. If the AI keeps going in circles, switch to a larger model or a higher thinking level (section 6).
14. Troubleshooting
The most common situations. In any case, you can describe the problem in the chat.
| What you see | What to do |
|---|---|
| The dashboard does not open after installation | In Manage Extensions select the extension and check Permissions status: if it is Revoked, click Grant. |
| “The dashboard could not be loaded” | Check that all files are in the same folder. Then copy the message into the chat. |
| A red message with a file name and a line, instead of the dashboard or of a widget | Copy the message and paste it in the chat. |
| The extension is not in the Extensions menu | Add it again with Manage Extensions > Add from file, choosing the .sbaa file. |
No .sbaa file is created when you drag the .qrc | Check that all the files of the zip are in the same folder as the .qrc, then tell the AI. |
| The footer shows an old version | Drag the .qrc onto Banana again and update the extensions. If needed, remove the extension and add the .sbaa again. |
| The first-time panel appears every time | Save the accounting file after closing the dashboard. |
| Monthly charts are empty | Check the opening and closing dates in the file properties. |
| Liquidity widget empty | Choose the cash and bank accounts with its Settings button. |
| Flat liquidity forecast | Enter the planned movements of the liquidity accounts in the Budget table. |
| “No budget found” | Enter the budget in the Accounts table (Budget column) or in the Budget table. |
| No previous year data | Link the file of the previous year in the file properties. |
| A data looks wrong | Compare it with the Banana reports (e.g. balance sheet, profit and loss) for the same period, then describe the difference in the chat. |
15. Good to know
- A report on your file. The dashboard works inside Banana, with an accounting file open, and displays its data.
- Double-entry only. Income/expense accounting and cash books are not supported yet.
- Read only. The dashboard never changes your accounting data.
- Settings in the file. Period, palette and widget settings are stored in the accounting file and travel with it. Another computer with the same extension and the same file shows the same settings.
- The widgets are fixed. You choose them in the chat; in the dashboard you only change their settings. To add or remove a widget, ask the AI.
- Check the data. The AI can make mistakes. Before relying on a dashboard, compare its data with the accounting file and Banana reports.
- Support. The generated code is yours and is not supported by Banana.ch SA. For problems with the dashboard, use the chat.
- Different AIs, different results. Claude and ChatGPT follow the same skill but may produce slightly different designs. The rules keep the results close; small differences can be adjusted in the chat.
- Privacy. The AI never sees your accounting data: it only writes the code. The data are read by Banana on your computer. Screenshots you add to the chat, however, are seen by the AI.
16. Updates
What if a new version of the skill is released?
Replace the files in your Claude or ChatGPT project (or upload the new skill). Your existing dashboards keep working; to benefit from the new version, ask the AI to rebuild or update your dashboard in a new chat.