Universele sjablonen voor businessplannen
Met Banana Boekhouding Plus kunt u businessplannen, budgetten en financiële prognoses opstellen volgens dezelfde logica als uw boekhouding. U kunt kosten, inkomsten en liquiditeit plannen en eenvoudig de financiële haalbaarheid van uw onderneming of een nieuw project beoordelen.
Begin met een van onze gebruiksklare universele sjablonen, pas deze aan uw behoeften aan en werk uw businessplan op een eenvoudige, gestructureerde en professionele manier uit:
Ontdek ook onze documentatie over Budgetten en financiële prognoses en leer hoe u kosten, inkomsten en toekomstige liquiditeit rechtstreeks in uw boekhoudbestand kunt plannen.
Naast de universele sjablonen op deze pagina (zie het zijmenu) zijn mogelijk ook de volgende bronnen interessant voor u:
Cashflow prognose voor freelancers en kleine bedrijven | Cash Manager (Free)
Cashflow prognose voor freelancers en kleine bedrijven | Cash Manager (Free)Het maken van een cashflowprognose met Banana Boekhouding is als het maken van een prognose met Excel, maar dan sneller, veiliger en volledig gratis. Dankzij het kant-en-klare model begint u meteen, u hoeft alleen maar de gegevens in te voeren.
U weet op voorhand hoeveel liquiditeit u heeft en hoelang u ermee kunt doen, wanneer en welke uitgaven u zult moeten doen en op welke inkomsten u kunt rekenen. U kunt de vermindering van de kosten simuleren en zien welk effect dit heeft op uw liquiditeit en winstgevendheid, inzicht krijgen in toekomstige verkoopvolumes en of uw kapitaal voldoende zal zijn.
We hebben deze leidraad opgesteld om u te helpen bij het maken van uw cashflowprognose en het oplossen van uw financiële problemen. Als u deze handleiding tot in detail volgt, zult u hierin slagen, want u kunt dit model altijd aanpassen en corrigeren, dus het is gemakkelijk om uw verwachtingen bij te stellen.
Maak uw bestand aan
- Maak een nieuw bestand aan door en kies dit model (Template ID +11044), gebruik een van de uitgelegde methodes.
- Stel met het commando Bestand → Bestands- en boekhoudingseigenschappen de periode, bedrijfsnaam en de basis munteenheid in.
- Sla het bestand op met het commando Bestand → Opslaan als.... Het is handig de bedrijfsnaam en het jaar in de bestandsnaam op te nemen.
Bijvoorbeeld "bedrijf-2020.ac2".
Zie ook Beheer boekhoudbestanden lokaal, online of in de cloud
Pas rekening- en categorieëntabellen aan
Voordat u uw eigen cashflow overzicht creëert moet u even uw rekeningen en categorieën naar uw wensen aanpassen.
Rekeningentabel
De rekeningentabel laat alleen de contanten rekening zien, of eigenlijk, de hoeveelheid geld in uw bezit. U kunt deze aanpassen door de rekeningnaam, de beschrijving en het beginsaldo aan te passen.

Categorieëntabel
Deze tabel bevat de inkomsten en uitgaven categorieën en de veranderingen in kapitaal. U kunt de categorieën veranderen door nieuwe toe te voegen, namen en volgorde te veranderen en categorieën te verwijderen die u niet nodig heeft. U kunt op elk moment de bijgewerkte saldi van iedere categorie zien.

Met de handige kapitaal in & kapitaal uit secties kunt u registreren:
- Injecties voor leningen en aflossingen
- Injecties door eigenaren en uitbetalingen
- Aan- en verkopen van vaste activa
Om op elk moment te weten hoeveel de cashflow is (wanneer u begint met het invoeren van de dagelijkse transacties) hoeft u alleen maar te kijken naar het bedrag in de rij "Netto verandering in kapitaal". Op deze manier weet u in een oogwenk of u een Instroom of een Uitstroom heeft en het exacte bedrag.

Creëer uw cashflow prognose
De bijzondere innovatie van Banana Boekhouding is de mogelijkheid om cashflowprognoses op te stellen om de liquiditeit te controleren en tijdig beslissingen te nemen voor uw bedrijf.
Daarom raden we u aan om uw eigen cashflowprognose aan te maken. Ga naar de budgettabel: deze tabel bevat alle geldstromen in- en uitgaand die u gedurende het jaar heeft.
Volg deze eenvoudige stappen om de prognose correct aan te maken:
- Voer bedrijfsinkomsten in
- Voer bedrijfkosten in
- Voer inkomend kapitaal in
- Voer uitgaand kapitaal in
Bedrijfsinkomsten invoeren
Begin met een lijst van al uw bedrijfsinkomsten en de bedragen ervan. Contante verkopen is het belangrijkste inkomen maar er zijn nog andere afhankelijk van uw activiteiten.
Bedrijfsinkomsten kunnen zijn:
- Contante verkopen
- Diverse contante ontvangsten
- Incasso's van klantenkredieten
- Rentes
Om een transactie in het budget toe te voegen moet u de datum (wanneer u de inkomsten verwacht), de einddatum (indien nodig), de herhaling (hoe vaak deze inkomsten worden herhaald, wekelijks, maandelijks of jaarlijks), de beschrijving, het bedrag in de kolom inkomsten en de inkomstencategorie invoeren.
In het model vind al kant en klare transacties waar u alleen maar even de bedragen hoeft in te voeren. U kunt ook nieuwe transacties invoeren, en bestaande aanpassen of verwijderen.
Om een zo nauwkeurig mogelijke schatting te maken kijkt u naar de waardes van het laatste jaar waarbij u het bedrag naar beneden afrond om voorzichtig te zijn.
Tips:
- Vertrouw alleen op zekere inkomsten
- Groepeer de inkomsten volgens hun herhaling (wekelijks, maandelijks of jaarlijks, ...)

Bedrijfskosten invoeren
Nu is het tijd om alle bedrijfskosten in te voeren. Zoals u deed voor de inkomsten moet u hier de uitgaven schatten door naar de bedragen van het laatste jaar te kijken, maar de bedragen af te ronden naar boven als u voorzichtig wilt zijn. Het is altijd beter om een onnauwkeurige prognose te maken aan het begin van het jaar dan verrast te worden door hogere uitgaven.
Bedrijfskosten kunnen zijn:
- Salarissen
- Vergoedingen
- Huur
- Verzekeringen
- Adverteren en promotie
- Nutsvoorzieningen
- Reizen
- Telefoon
- Bankkosten
- Rentes
- …
Tip:
- Groepeer de uitgaven volgens hun herhaling (wekelijks, maandelijks of jaarlijks, ...)

Inkomend & uitgaand kapitaal invoeren
Deze sectie is erg handig om een netto cashflow prognose te hebben en niet alleen een bedrijfsmatige. U moet in dit geval de verwachte inkomende en uitgaande kapitaal transacties invoeren en de investeringen in en verkopen van vaste activa.
Ingaand kapitaal kan zijn:
- Injecties voor leningen
- Cash injecties door eigenaren
- Verkoop van vaste activa
Uitgaand kapitaal kan zijn:
- Aflossing van leningen
- Uitbetalingen aan de eigenaren
- Aankoop van vaste activa

Beheer uw cashflowprognose
Het is belangrijk meteen te weten of uw zaak, met uw schattingen, een positieve cashflow genereert of niet.
U bent toch ook nieuwsgierig? Het prognoseoverzicht geeft u het antwoord!
Deze controle is heel gemakkelijk: ga naar Rapporten → Uitgebreide rekening op groepen en kies van de lijst die verschijnt het overzicht Planning per jaar. Klik OK om de prognose te zien.
Een doel van elk bedrijf is zeker een positieve cashflow te hebben omdat men alleen daarmee kan overleven, of gewoon om leveranciers te betalen of schulden af te lossen. ... Controleer het item Netto verandering cash (onderaan het overzicht) en verzeker u ervan dat u een positief resultaat heeft (Instroom). In dat geval kunt u blij zijn omdat u uw bedrijf goed beheert!
Als u echter een negatieve netto cashflow heeft (Uitstroom) betekent dat helaas dat uw bedrijf een probleem heeft met het beheer van de liquiditeit. Wat u in dit geval eerst moet doen is opnieuw uw geschatte inkomsten en uitgaven controleren om te zien of er aanpassingen gemaakt moeten worden of fouten gecorrigeerd waardoor de cashflow verbeterd wordt. Als u nog steeds een negatieve cashflow heeft moet u nadenken over acties die gedaan kunnen worden om het liquiditeitsbeheer voor het volgende jaar, of wanneer de budgetperiode start, te verbeteren. Het meest waarschijnlijke is dat u moet proberen uw bedrijfskosten te verlagen.


Als u naast de jaarprognose een nog betere greep wilt hebben op de liquiditeitsontwikkeling (bijvoorbeeld hoe deze zich gedurende het jaar ontwikkelt) kunt u kiezen voor maand-, kwartaal- en 4-jaars overzichten, of uw eigen overzicht creëren. Dit alles altijd via Rapporten → Uitgebreide rekening op groepen.


De transacties invoeren
Met de cashflowprognose onder controle kunt u starten met het boeken van de diverse geldtransacties en deze van tijd tot tijd vergelijken met de verwachte bedragen.
De geldtransacties invoeren
Dagelijkse transacties moeten ingevoerd worden in de transactiestabel. Het doen van een boeking gaat op dezelfde manier als u deed voor de prognose in de budgettabel (het enige verschil is dat u geen kolom "herhalen" heeft). Er zijn in ook de transactiestabel van het model enkele voorbeelden die u kunt aanpassen of verwijderen.

Controleer de mutaties met de rekeningkaarten
Bij het geleidelijk aan invoeren van uw transacties kan het handig zijn te controleren hoe de contantenrekening of een specifieke categorie zich in de tijd ontwikkeld heeft. Dit kunt u doen door de betreffende rekening/categorie kaart te bekijken. Bijvoorbeeld, door de Contanten rekeningkaart te selecteren krijgt u een overzicht van alle mutaties ervan. Door ook op het tabblad grafieken onderaan te klikken krijgt u een nog beter zicht op de prestatie van de rekening.
Tip: Controleer uw contantenrekening minstens eenmaal per maand om direct de vooruitgang te zien en deze te vergelijken met die van de laatste maanden.

Controleer het verschil tussen saldo en budget
Voor nog meer controle over uw bedrijfsvoering kunt u naar de rekening- of categorieëntabel gaan, de weergave budget kiezen en kijken naar de kolom Verschil budget. Deze laat u het verschil zien tussen de werkelijke saldi en de waardes die u heeft gebudgetteerd. Op deze manier heeft u een extra indicator waarmee u kunt zien of u het budget goed volgt en waarmee u betere beslissingen kunt nemen.

Vergelijk de prognose met het overzicht
Gedurende het jaar kunt u op elk moment uw huidige situatie vergelijken met de prognose, om te begrijpen of en waar u meer uitgeeft, om vooraf beslissingen te kunnen nemen. Aan het einde van het jaar kunt u de uiteindelijke vergelijking maken tussen de actuele rapportage en de prognose om te zien of u de verwachte netto cashflow heeft bereikt.
Maak het controle overzicht aan met menu Rapporten → Uitgebreide rekening op groepen → Jaarlijks verslag vergeleken met planning.

Als u een nauwkeuriger en doelgerichter beeld wilt hebben, kunt u rapporten maken met een maandelijkse onderverdeling, waarin ook het verschil tussen het saldo en de begrotingswaarde van elke maand is opgenomen. Dit geeft u een overzicht van de maanden waarin u de meeste liquiditeitsproblemen had en de maanden waarin u het meeste verdiende.

U bent aan het einde van het jaar aangekomen, dus u zult nu het volgende jaar opnieuw moeten plannen om een nieuwe cashflowprognose te maken, precies zoals u tot nu toe hebt gedaan. Stop niet, alleen op deze manier zult u uw cashflow meer en meer zien verbeteren!
Business plan en budget van een Startup (Inkomsten/Uitgaven boekhouding)
Business plan en budget van een Startup (Inkomsten/Uitgaven boekhouding) anneliesBusiness plan en budget van een Startup (Dubbel boekhouden)
Business plan en budget van een Startup (Dubbel boekhouden) anneliesTutorial file for amortisation and interest calculation with budget's formulas
Tutorial file for amortisation and interest calculation with budget's formulasThe possibility to enter formulas is available in Banana Accounting Plus only with the Advanced plan. Update now!
Financiële planning met formules
Financiële planning met formules anneliesTutorial File Budget Formulas For Multi-Currency Financial Planning
Tutorial File Budget Formulas For Multi-Currency Financial PlanningThe possibility to enter formulas is available in Banana Accounting Plus only with the Advanced plan. Update now!
This example will explain how to use formulas specific to double-entry bookkeeping with multi-currency functionalities.
Documentation on use of formula in the Budget table.
Amount calculation in base currency
The formula will calculate the value in the account's currency first and then the relative value in the base currency.
Exchange rates and historical rates
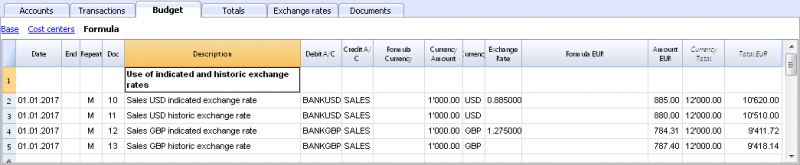
- Doc 10 and 12.
If an exchange rate is indicated in the exchange rate column, the program will calculate the amount in the base currency (EUR in this case) using the exchange rate indicated in this row. - Doc 11 and 13.
If there is no exchange rate indicated, the program will apply the exchange rate in the Exchange rates table for this calculation as well as for the successive operation in the case a Repeat function is applied.
-
If historical exchange rates are defined in the Exchange rates table, via adding a date, the program will apply the exchange relative to the date or the previous, most recent one.
Use of formulas in the base currency
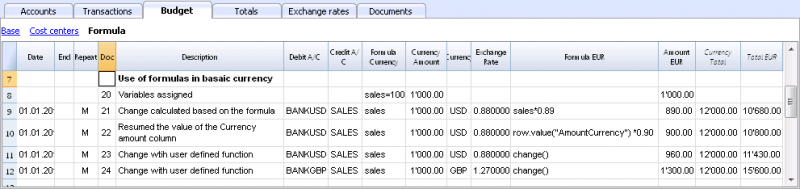
All formulas available in the Budget table can be used in the Formula column.
The following examples show the value in the base currency (EUR) calculated according to a Formula.
- Doc 21.
The sales value is multiplied according to the Formula EUR value. The exchange rate in the corresponding column will be ignored. - Doc 22.
As in the previous example, but for the value of "AmountCurrency" which is the result of the formula. - Doc 23.
In the “budget.js” document we have defined an exchange rate function calculating the value on the basis of the contents in the row.
With these functions it is possible to create exchange rate simulations.
Example for Exchange rate function
The USD exchange rate is established on a monthly basis.
A constant exchange rate is used for GBP instead.
The function will result as the amount of AmountCurrency multiplied by the exchange rate.
  function cambio() {
    var importo = row.value("AmountCurrency");
    var cambio = 1;
    var moneta = row.value("ExchangeCurrency");
    var data = Banana.Converter.toDate(row.value("JDate"));
    var mese = data.getMonth() + 1;
    if (moneta == "USD") {
      cambio = 0.95;
      if (mese == 1)
      cambio = 0.96;
    else if (mese == 2)
      cambio = 0.97;
    }
    if (moneta == "GBP") {
    cambio = 1.30;
    }
    return importo * cambio;
  }
Formulas for calculation of exchange rate differences
For further information on calculation of exchange rate differences please refer to information about transactions in multi currency and to the Create exchange rate differences command.
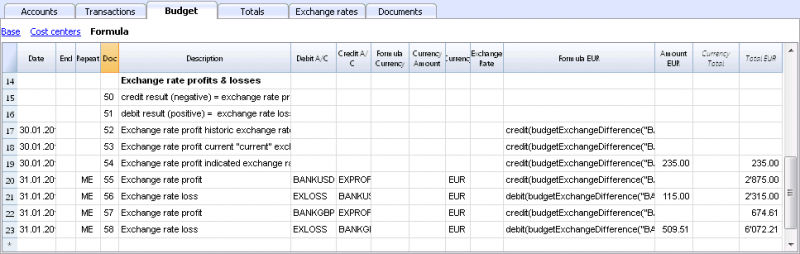
- The currency is always the base currency.
- Amounts must not be entered in the account's currency.
- Exchange rate is left blank and will be ignored, even if a value is entered.
- The budgetExchangeDifference function calculates the exchange rate difference for an account. This value represents the non realized exchange rate profit or loss.
.- The function will return a positive value if it is an exchange rate loss and a negative (credit) in case of exchange rate profit.
Exchange rate profit and exchange rate loss need to be entered in two different rows.
-
The resulting amount represents the revaluation necessary in the base currency to ensure that the account balance in the base currency matches the balance of the account in the currency converted at the exchange rate used for the calculation of exchange rate differences.
- The function will return a positive value if it is an exchange rate loss and a negative (credit) in case of exchange rate profit.
- The first parameter "CUSD" of the budgetExchangeDifferences function is the account in foreign currency for which the exchange rate difference will be calculated.
- The second parameter is the exchange rate to be applied.
- If no exchange rate is indicated, the historical exchange rate relative to the date of the entered transaction is applied.
- When "current" is used, the exchange in the Exchange rate tables with no date will be used.
- An exchange my also be indicated. A point "." must be used as a decimal separator.
  credit(budgetExchangeDifference("CUSD"))
  credit(budgetExchangeDifference("CUSD", "current"))
  credit(budgetExchangeDifference("CUSD", "0.95"))
Tutorial Financial Planning for Accounting Experts
Tutorial Financial Planning for Accounting ExpertsThe Detailed Budget allows you to plan the future activities of an accounting firm by entering individual budget transactions in the Budget table.
In this tutorial, you will learn how to plan client revenues, collections and the firm's costs, and how to analyze their impact on the Income statement, Balance Sheet and liquidity.
You will also learn how to compare budget data with actual data to identify variances from what was planned.
Introductory video
To see the system in action, watch our video:
Who this tutorial is for
This tutorial is designed for the financial planning and accounting of:
- accounting firms;
- fiduciary firms;
- consultants and accountants.
You can use this method both to plan your firm's activities and to prepare financial plans for your clients, integrating financial advisory services with accounting management.
Planning structure
The financial planning of the accounting firm uses the same chart of accounts as the accounting.
Budget transactions are entered in the Budget table and automatically generate the budget values for the accounts and the related reports.
In particular, the model includes planning for:
- expected revenues from individual clients;
- expected collections;
- the firm's costs;
- the related impact on the Income statement, Balance Sheet and liquidity.
In the Accounts table, the Budget column allows you to directly view the values resulting from the financial plan.
Assets and Liabilities – Balance Sheet
In the Balance Sheet section, the Budget column shows the budget balances of the accounts, including those relating to liquidity and accounts receivable.
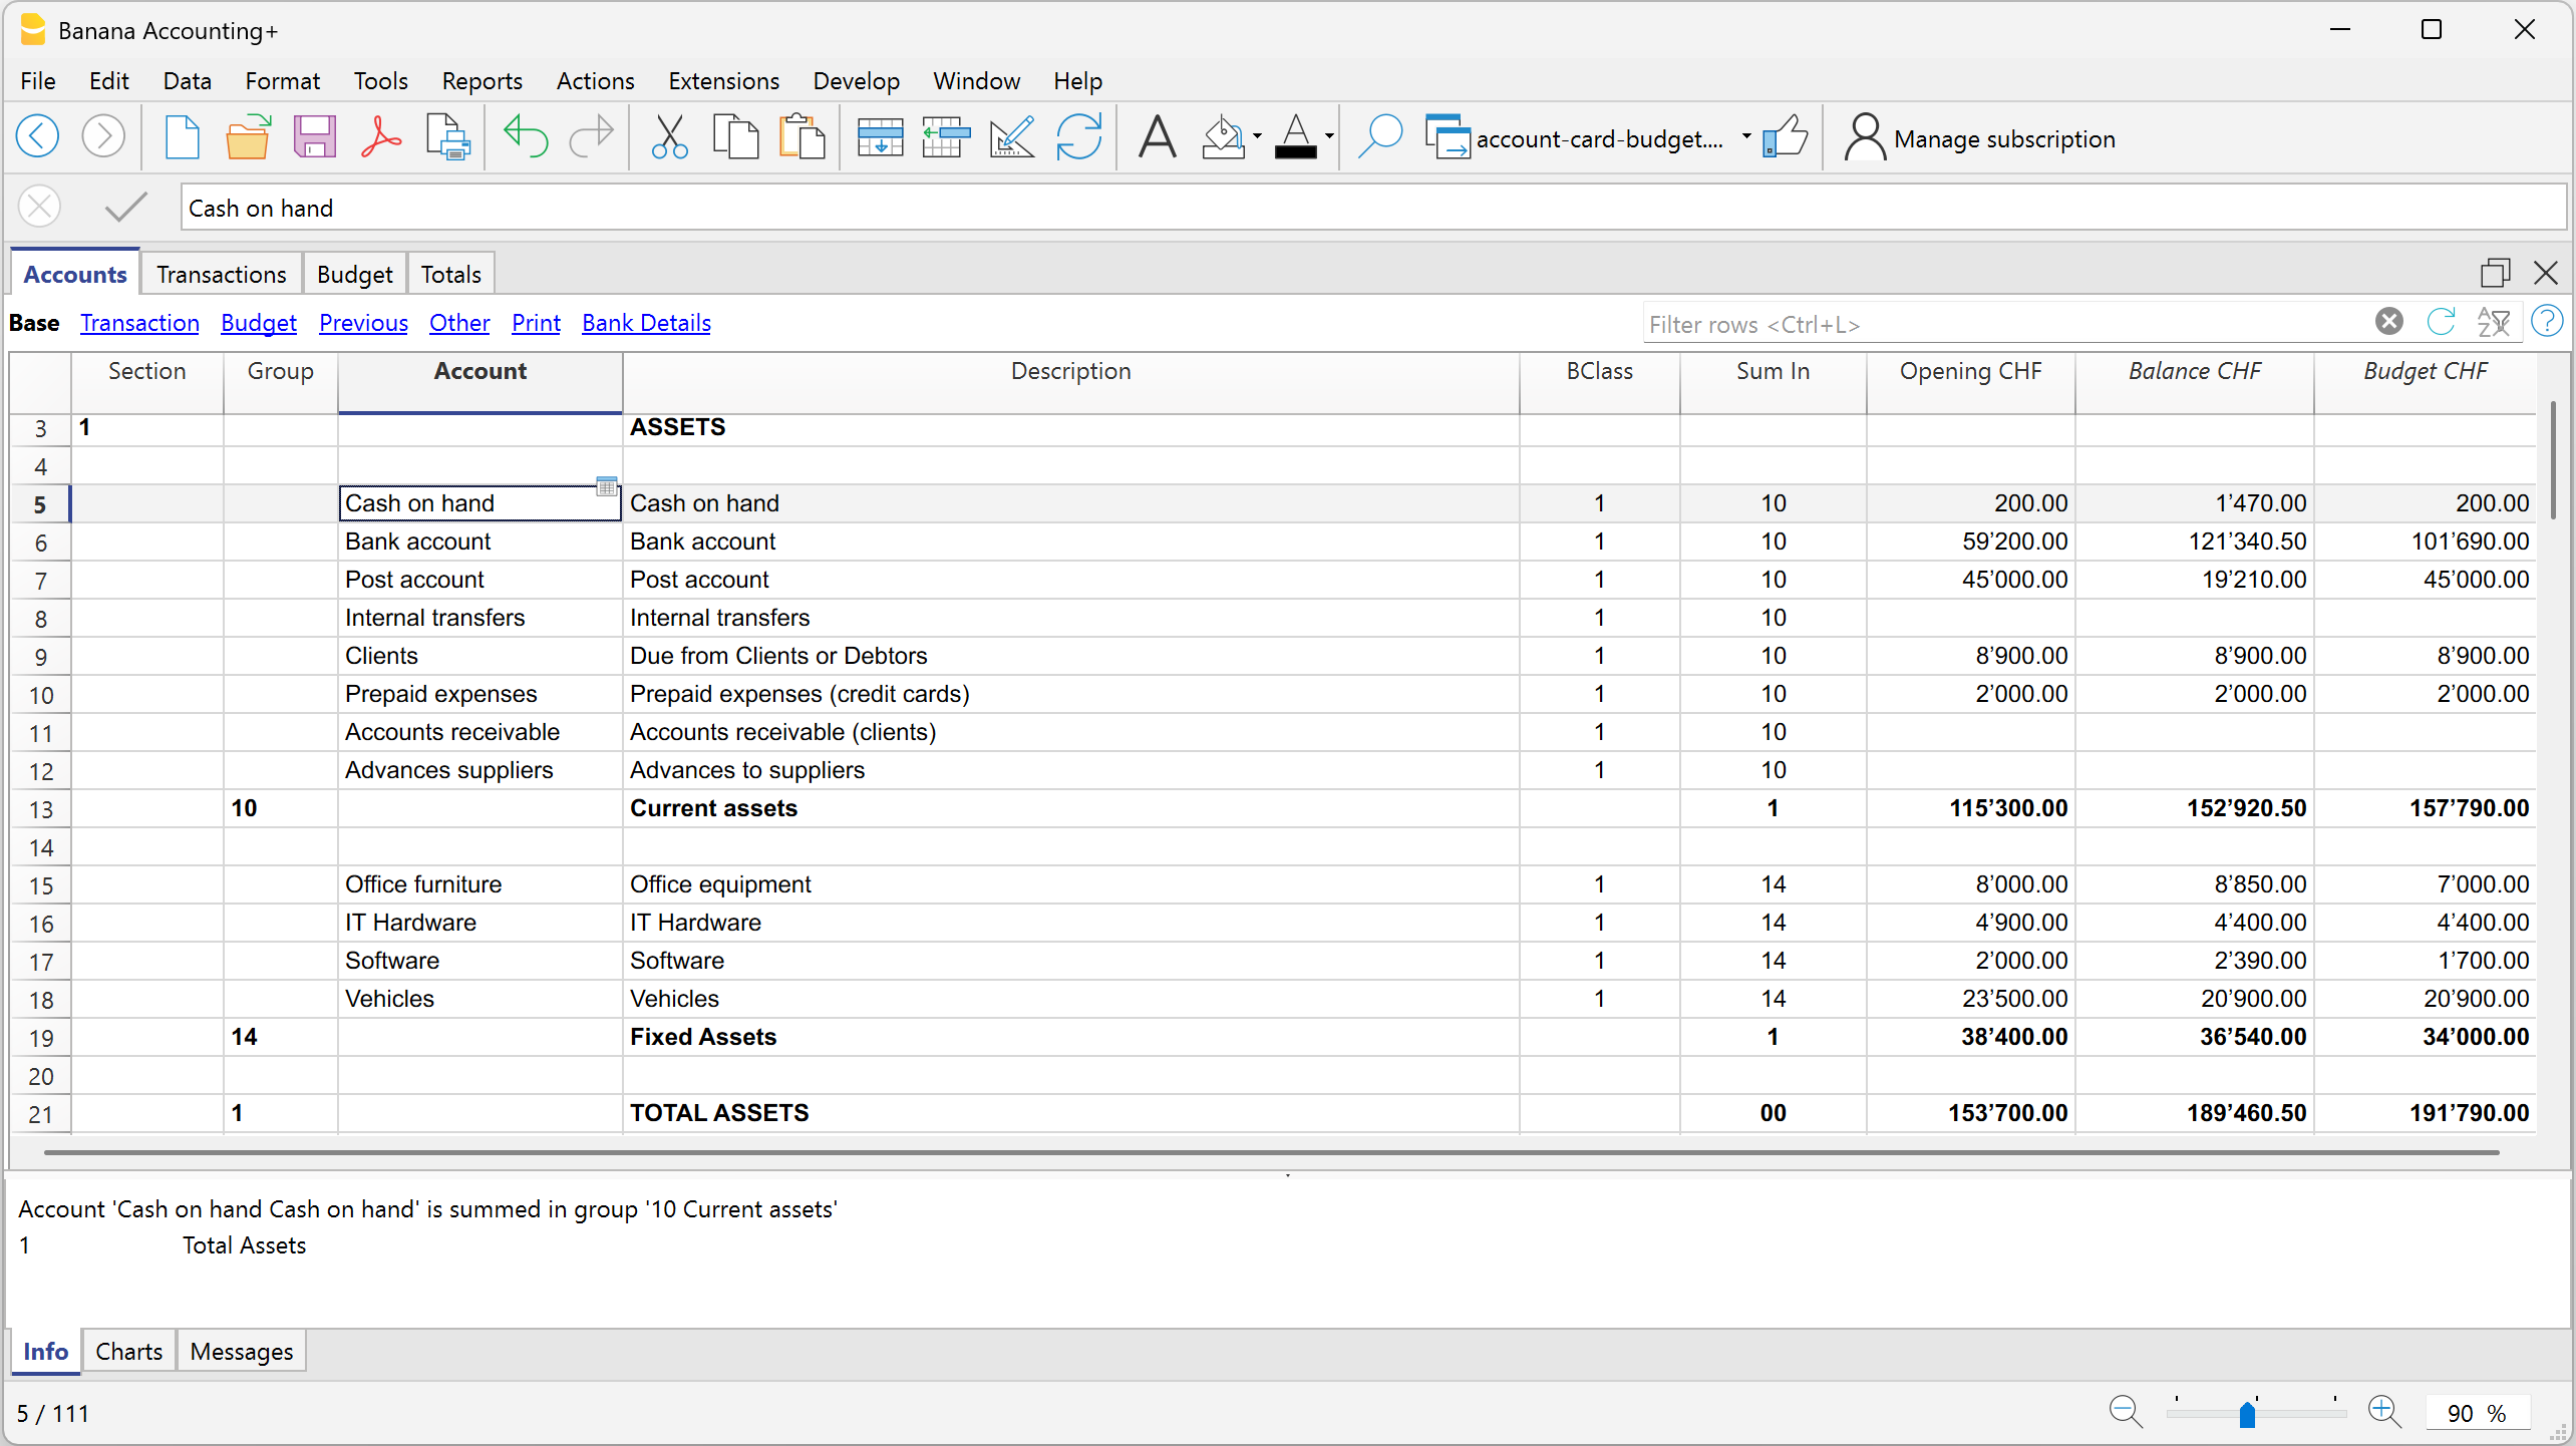
Expenses and Revenue – Income statement
In the Expenses and Revenue section, the Budget column shows the expected expenses and revenues and the financial result generated by the planned transactions.
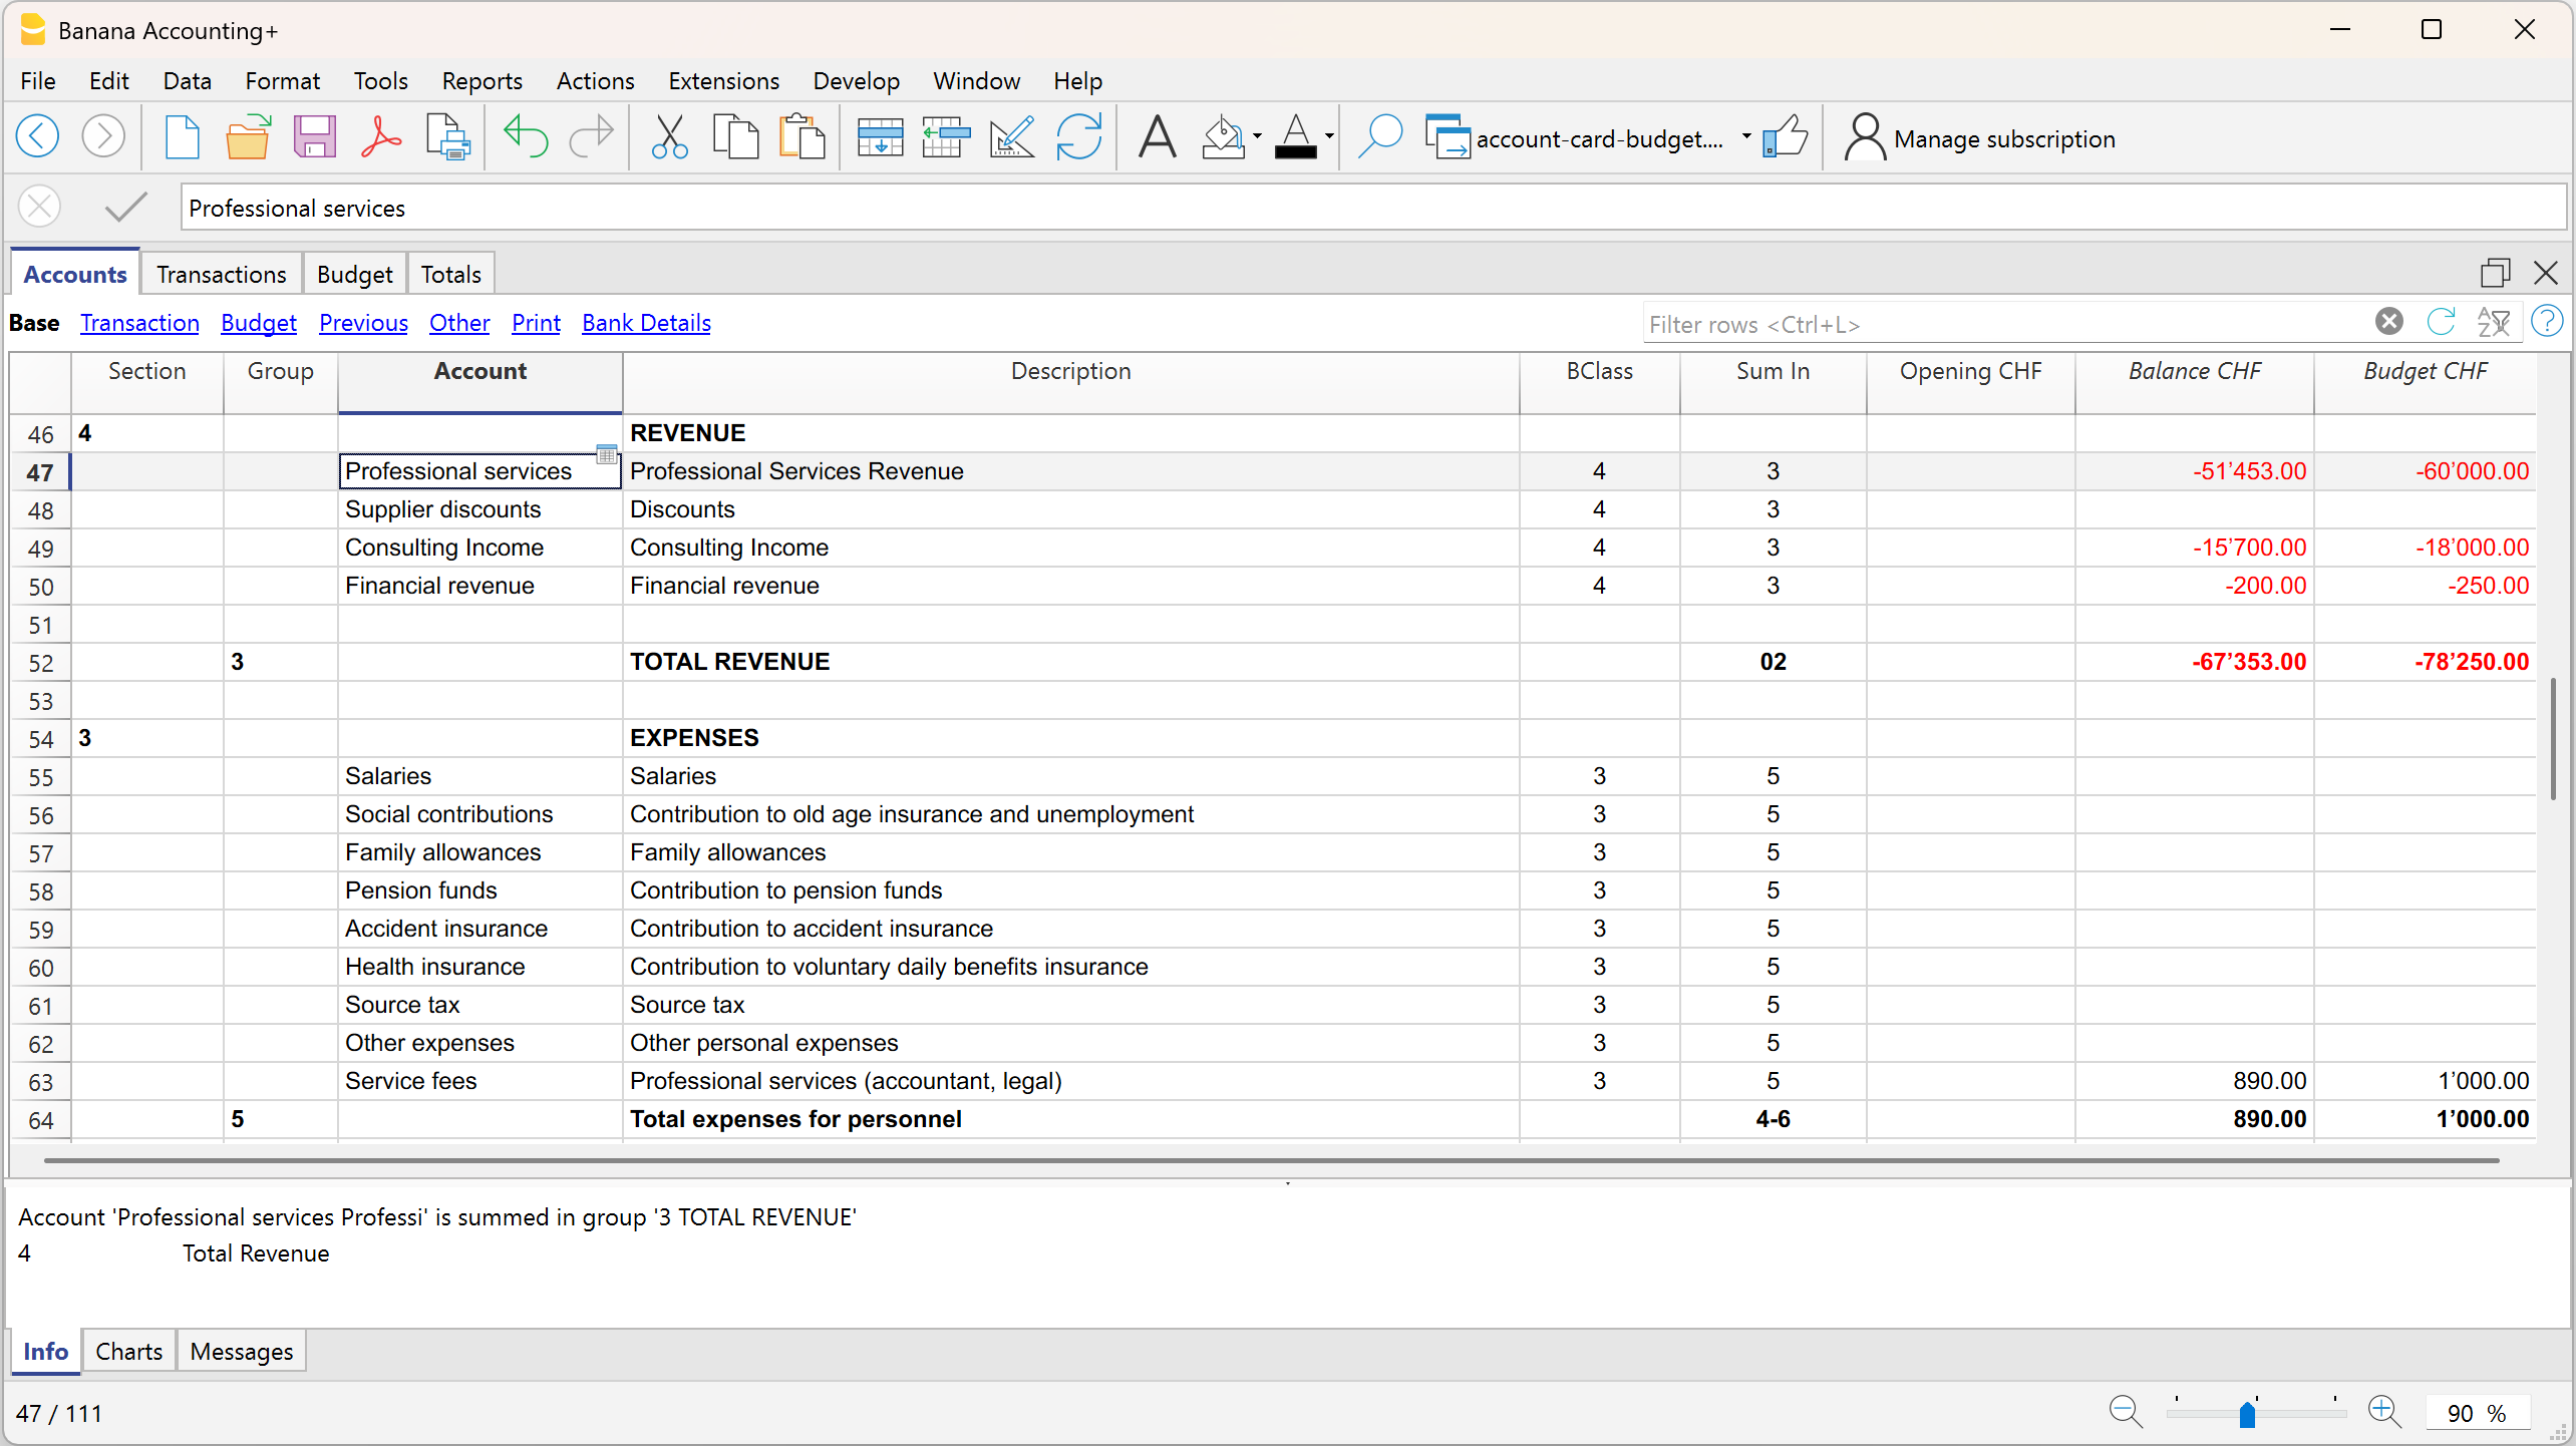
Budget table
The Budget table contains the transactions used to build the firm's financial plan.
In this example, the firm's revenues are planned according to the clients and the expected invoicing frequency.
For a financial plan divided according to additional criteria, the tutorial also uses:
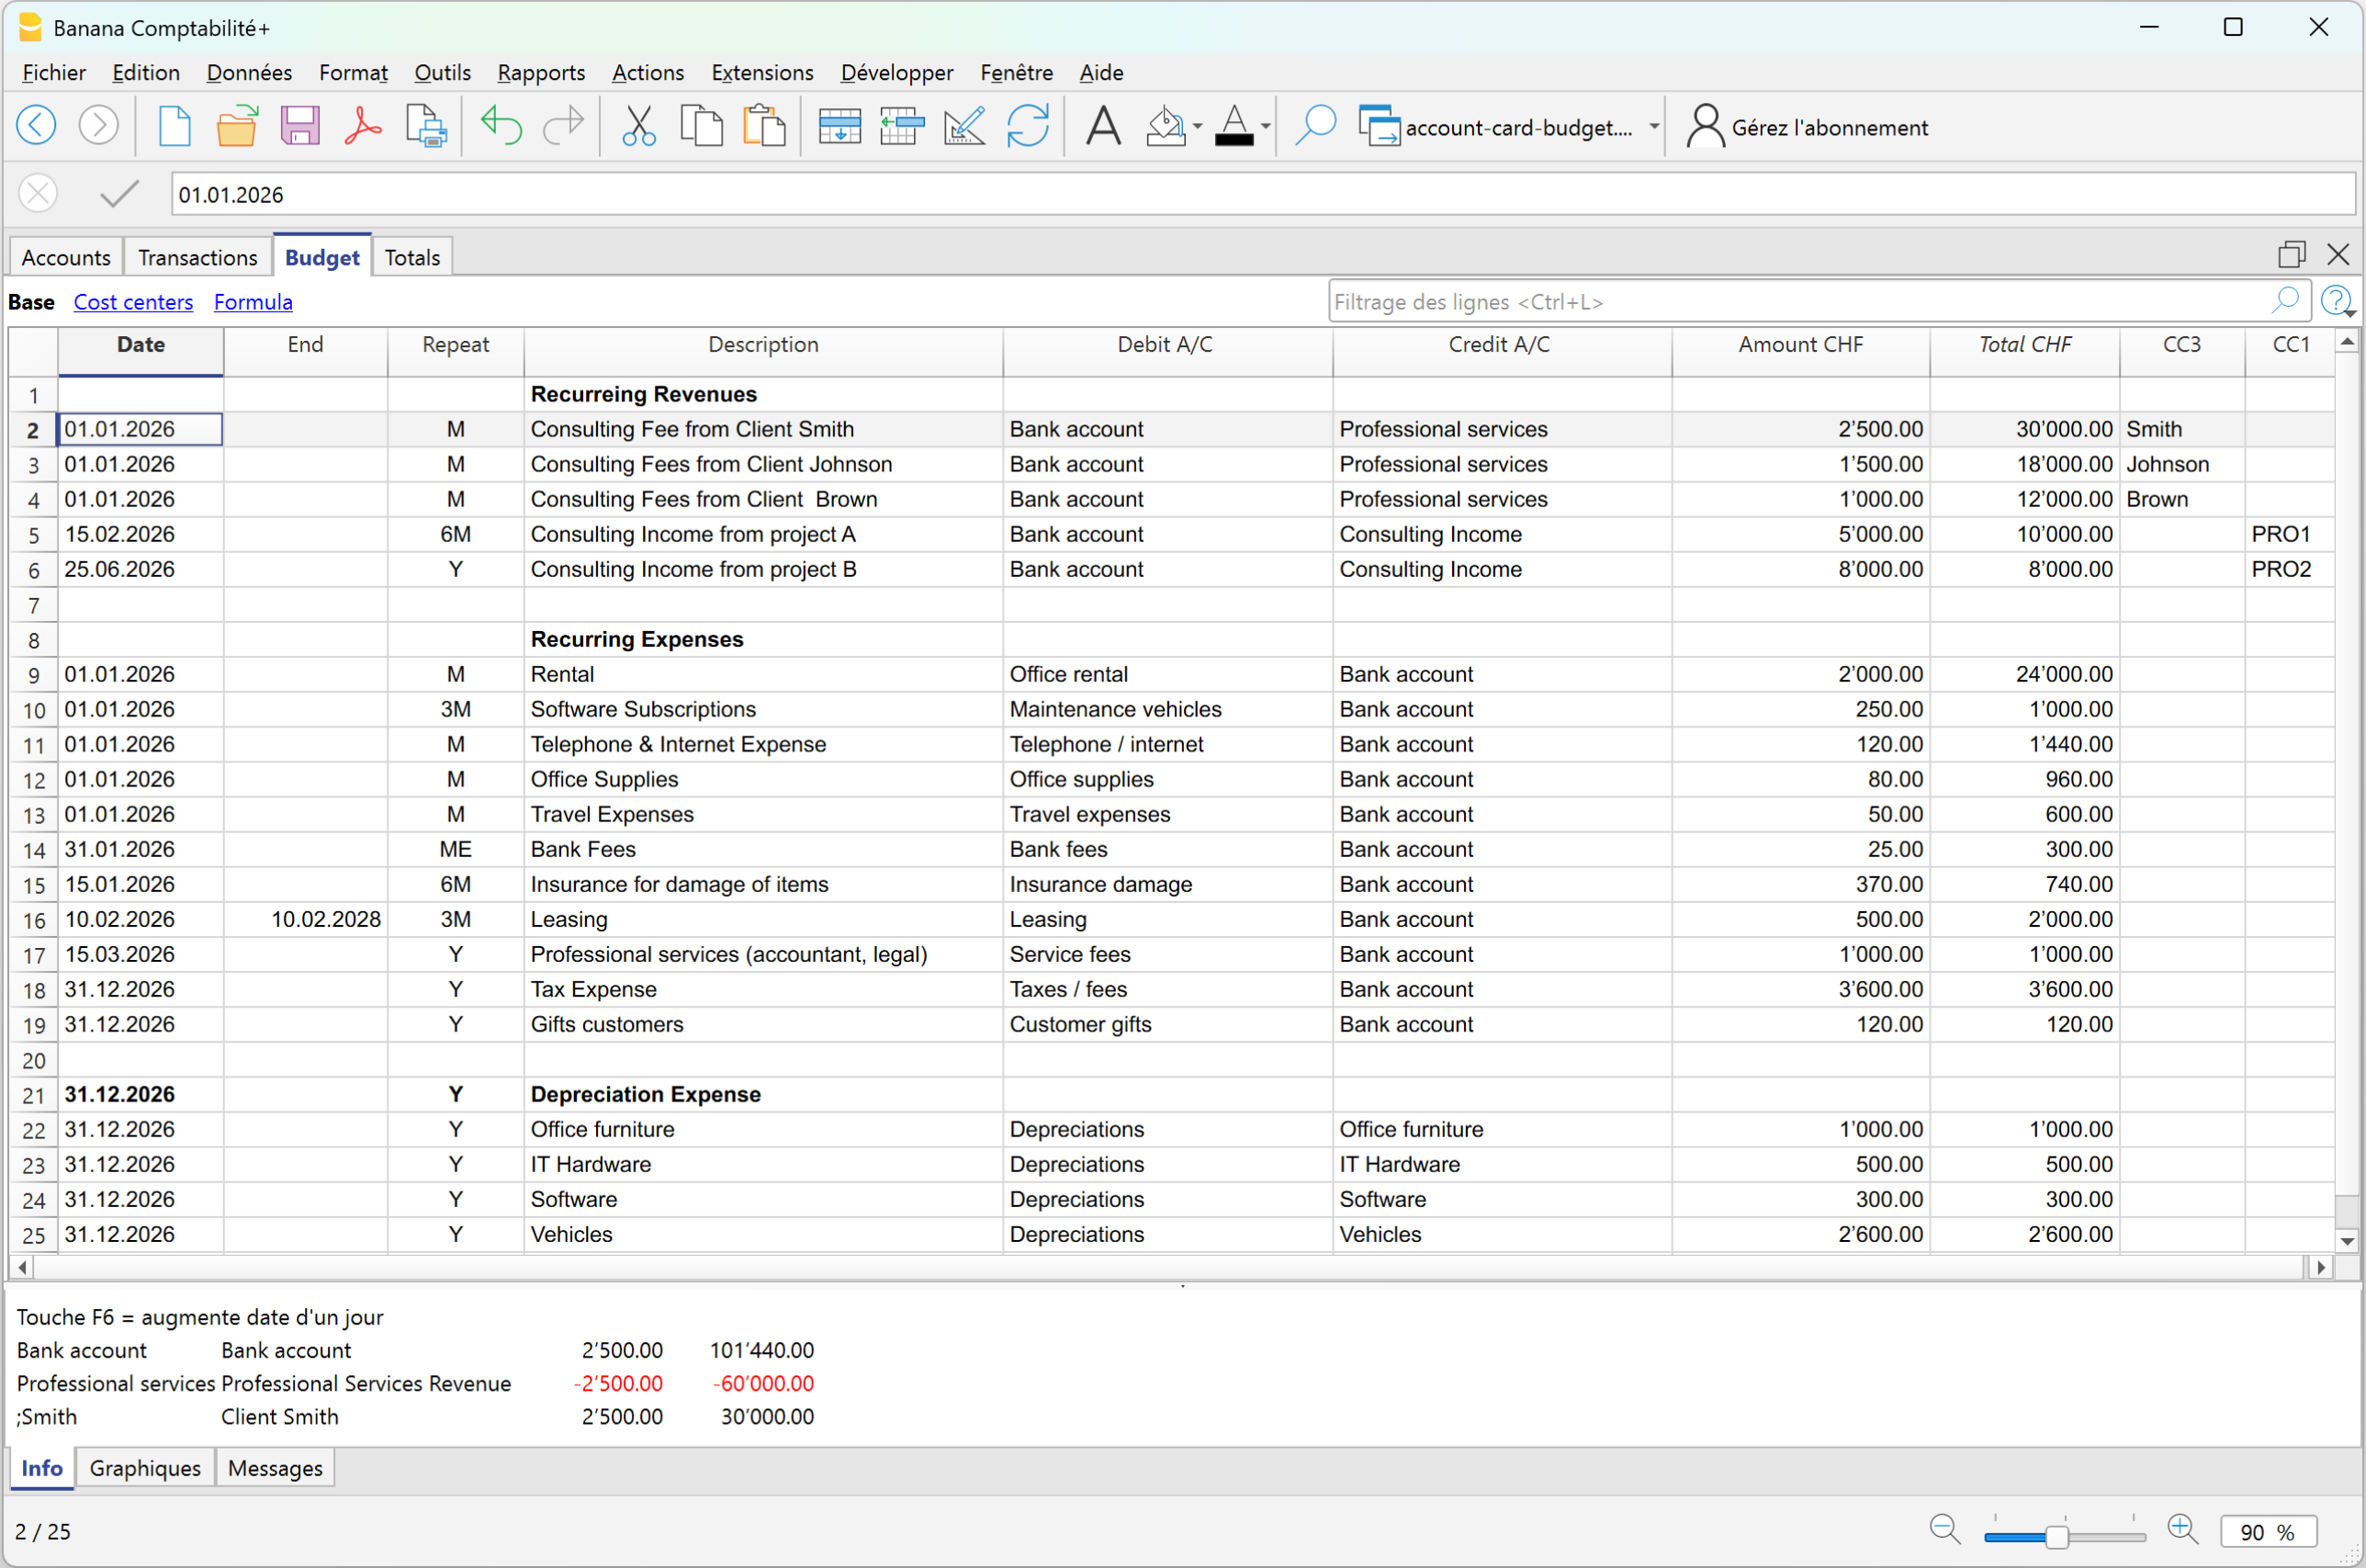
For example, the plan includes:
- monthly revenues from clients such as Smith, Johnson and Brown;
- quarterly revenues from other clients such as Wilson, Carter and Thompson;
- an annual accounting service of CHF 6'800;
- occasional revenues of CHF 5'000 every six months;
- annual interest income of CHF 250.
The Repeat column allows you to define the expected frequency. A single transaction can therefore generate the total annual amount. For example, the monthly fee of CHF 2'500 for client Smith generates expected annual revenues of CHF 30'000.
Cost and profit centers have also been included in the plan to distinguish individual clients and group revenues according to their type, such as monthly, quarterly, annual or occasional revenues.
If necessary, you can also use the VAT Code in budget transactions to forecast the VAT payable to the tax authorities and the liquidity required for the related payment.
For more information about entering transactions, repetitions and other functions, see the Budget table page.
Once the budget transactions have been entered, Banana Accounting automatically performs all calculations: it determines the account balances and the impact on the Income statement, Balance Sheet and liquidity. There is therefore no need to perform calculations or manually transfer values to the reports.
Budget reports and comparison with actual data
The transactions planned in the Budget table are automatically included in the reports.
By displaying Actual, Budget and Difference in the same report, you can check not only the expected result, but also how the actual business activity is developing compared with the financial plan.
Balance Sheet
The report allows you to compare the actual financial position with the budget and view the related differences.
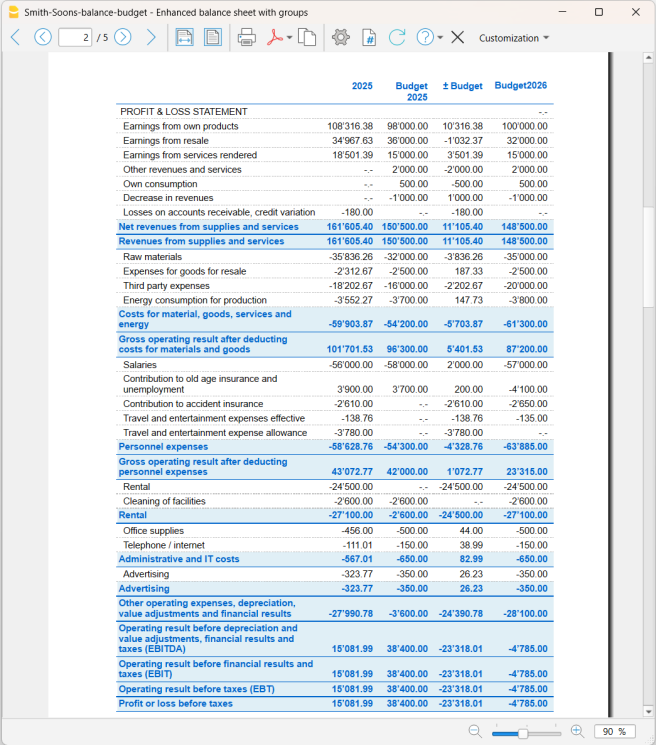
In this example, total budgeted assets are CHF 196'590, while the actual amount is CHF 189'460.50, resulting in an overall difference of CHF -7'129.50.
The difference is also visible in the individual accounts. For example, the bank account has an actual balance of CHF 121'340.50 compared with the budgeted CHF 106'490, while the postal account has CHF 19'210 compared with the planned CHF 45'000.
The report therefore makes it possible to understand not only whether the overall financial position is in line with the Budget, but also which accounts have contributed to the variances.
The actual profit shown in the Balance Sheet is CHF 34'760.50, compared with a budgeted profit of CHF 42'890, resulting in a variance of CHF -8'129.50.
Income statement
The Income statement allows you to identify the source of the variance in the result.
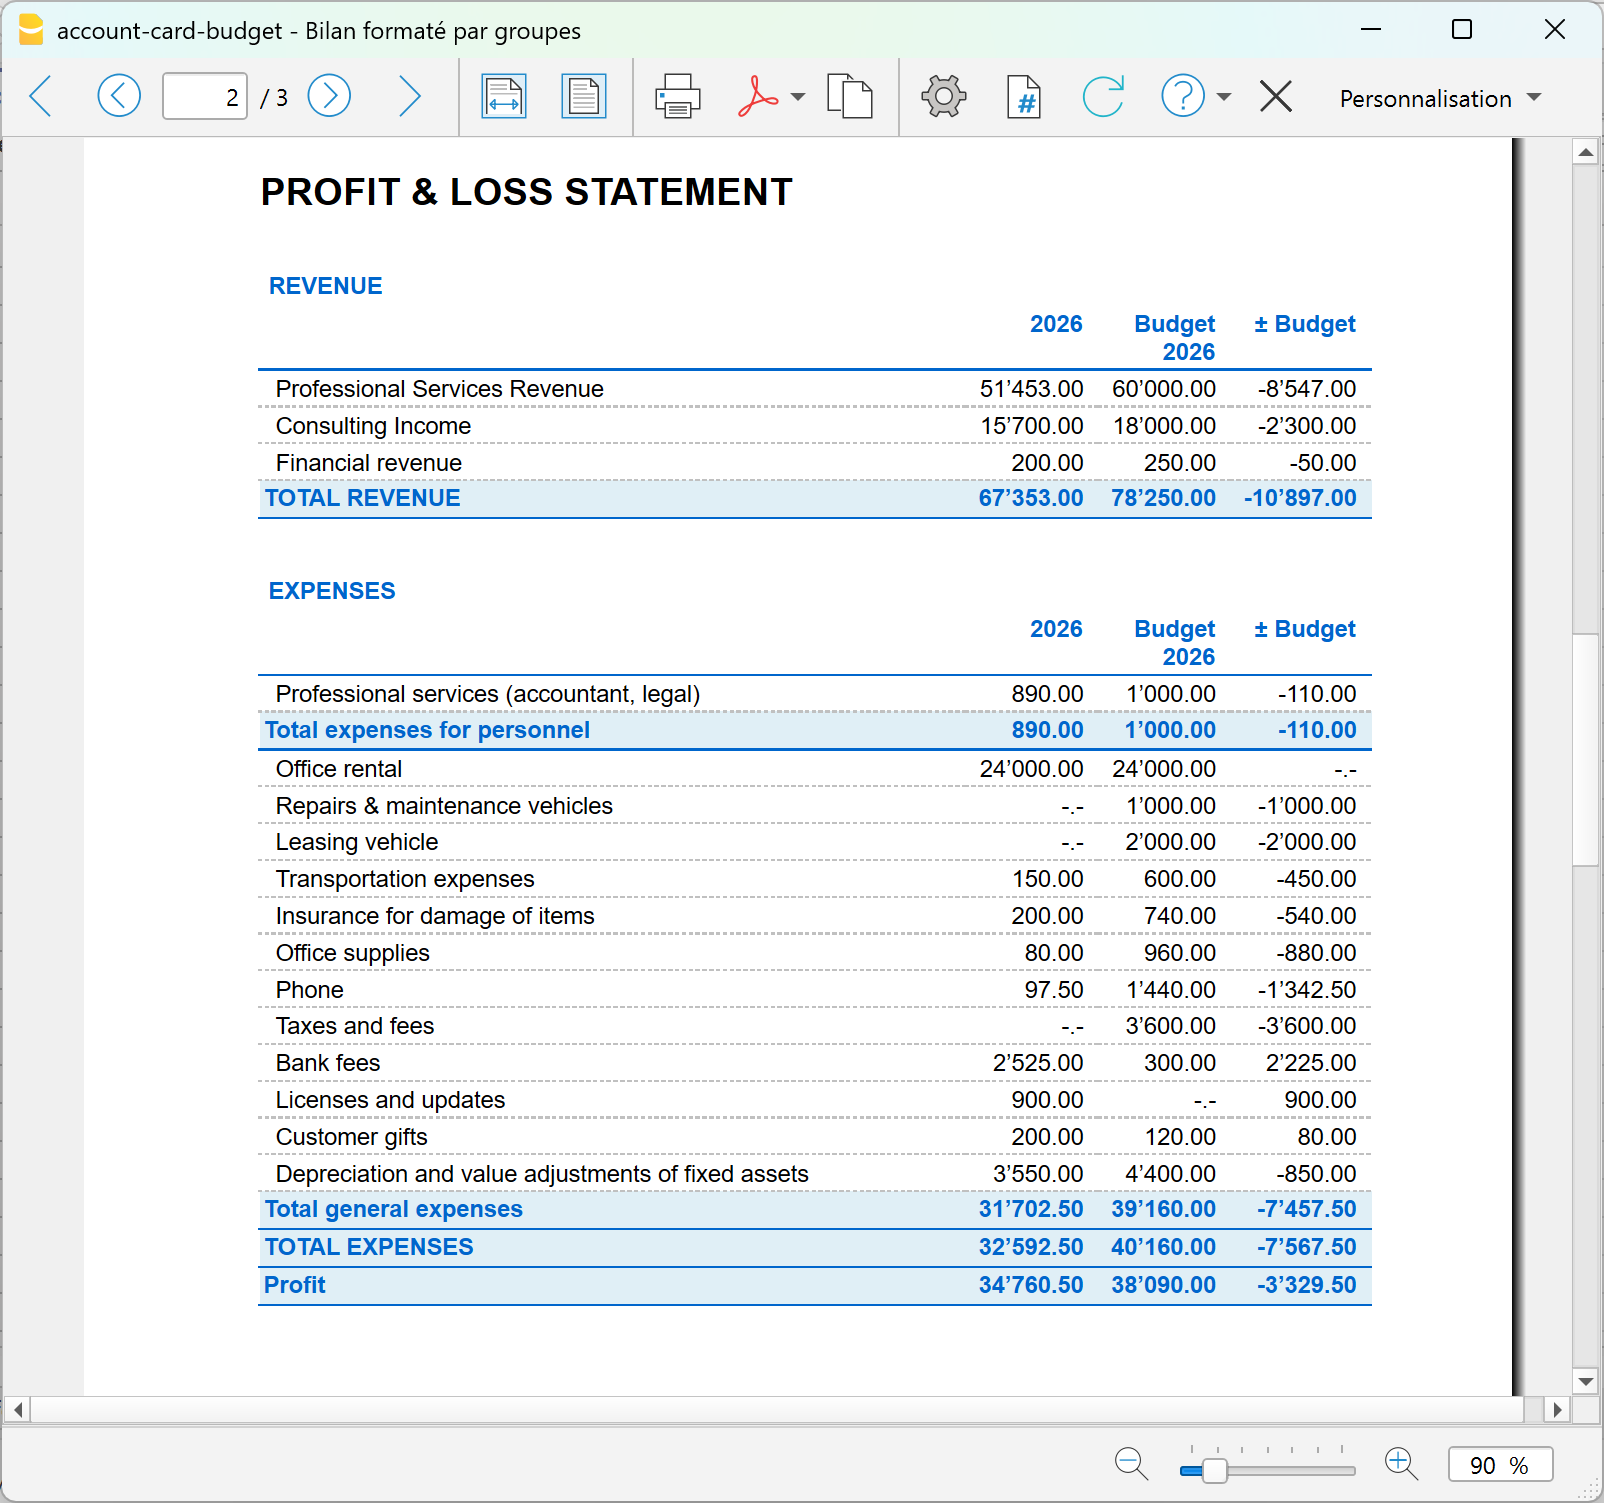
In this example, total revenues of CHF 83'050 were budgeted, while the actual amount is CHF 67'353, resulting in a variance of CHF -15'697.
The difference is almost entirely due to revenues from professional services: CHF 82'000 was budgeted, while CHF 67'153 was actually recorded.
Costs also show differences compared with the plan. General costs amount to CHF 31'702.50, compared with the budgeted CHF 39'160. Costs are therefore CHF 7'457.50 below budget, partially offsetting the lower revenues.
The final result is a profit of CHF 34'760.50, which is CHF 8'129.50 lower than the budgeted CHF 42'890.
Account card: comparison between actual and budget
When a difference appears in a report, you can analyze it down to the individual transactions using the account card.
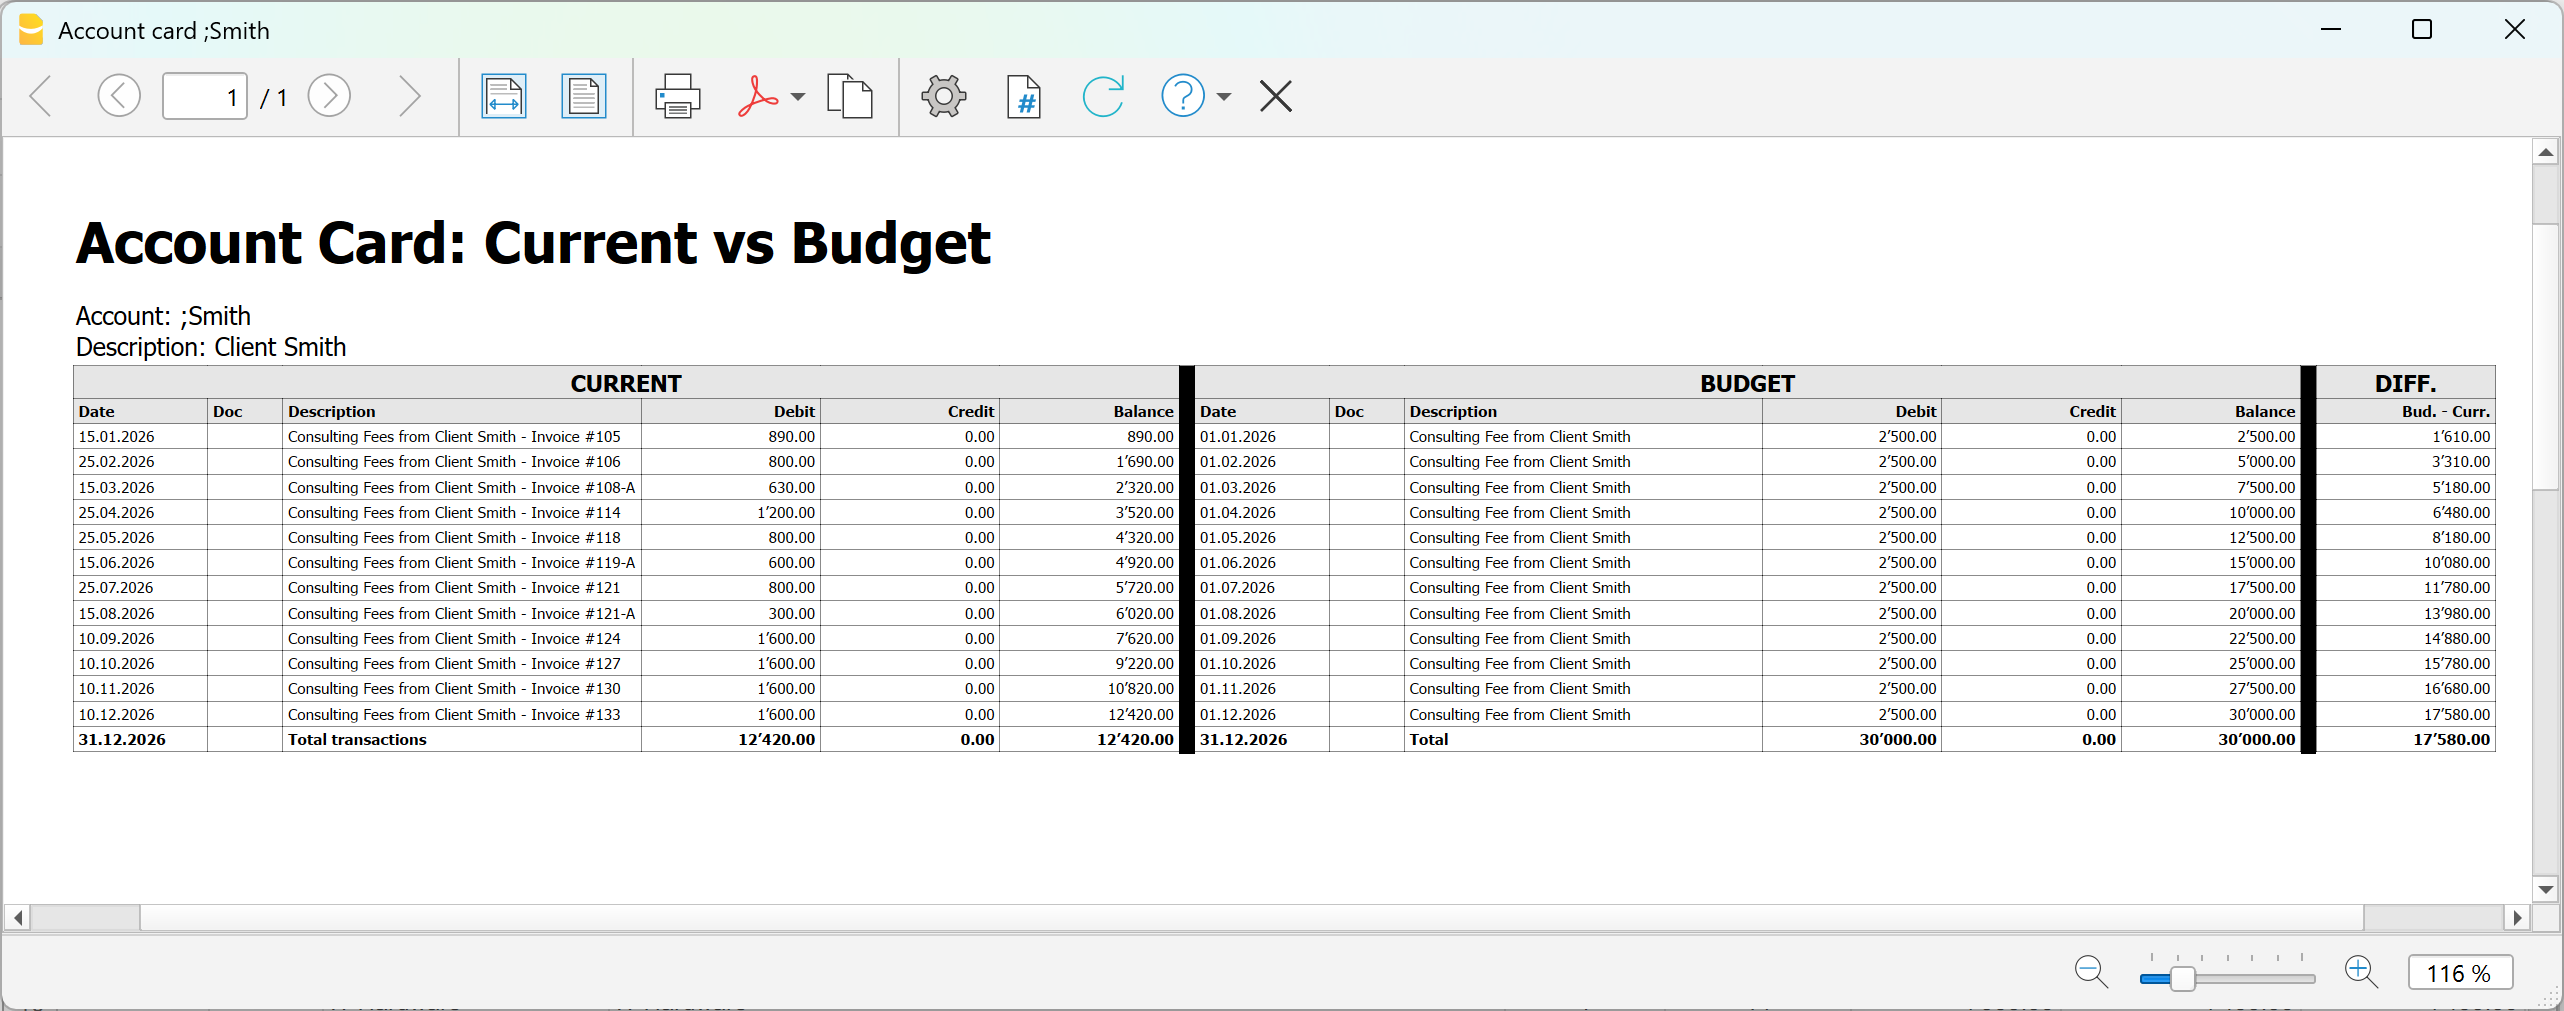
In the example relating to a client, you can directly compare:
- the transactions actually recorded;
- the budget transactions;
- the related differences.
This allows you to check whether the invoices or collections planned for the client actually occurred and identify the transactions that caused the variance.
The same type of analysis can be carried out for accounts, projects, Cost and profit centers and Segments.
For information about installing and using the extension, see Account card: Current vs Budget.
In summary
The Detailed Budget allows you to start from the individual revenues and costs planned for the firm, automatically obtain the expected financial and economic position, and progressively compare it with actual data.
This allows you to identify variances in the reports and, when necessary, analyze them down to the individual transactions.
Account Card: Current vs Budget (BETA)
Account Card: Current vs Budget (BETA)The report provides:
- detailed transaction data
- progressive balances
- differences between actual and planned values
Prerequisites
To use this extension you must download and install Banana Accounting Plus.
Create the report
Run the extension from the menu Extensions > Account Card: Current vs Budget.
The extension Settings dialogue will open. From here you can choose some options to create the report.
- Account
Select the account to analyze (populated automatically from the Accounts table). - Subdivision by period
Select the period subdivision (none, by month, by quarter).- None: shows all transactions in chronological order.
- By month: groups transactions by month; each month is visually separated.
- By Quarter: groups transactions by quarter (Q1, Q2, Q3, Q4); each quarter is visually separated.
- Print in landscape
Prints the report in landscape orientation.
The report will be generated and shown in preview.
Report content
The report is structured into three main sections:
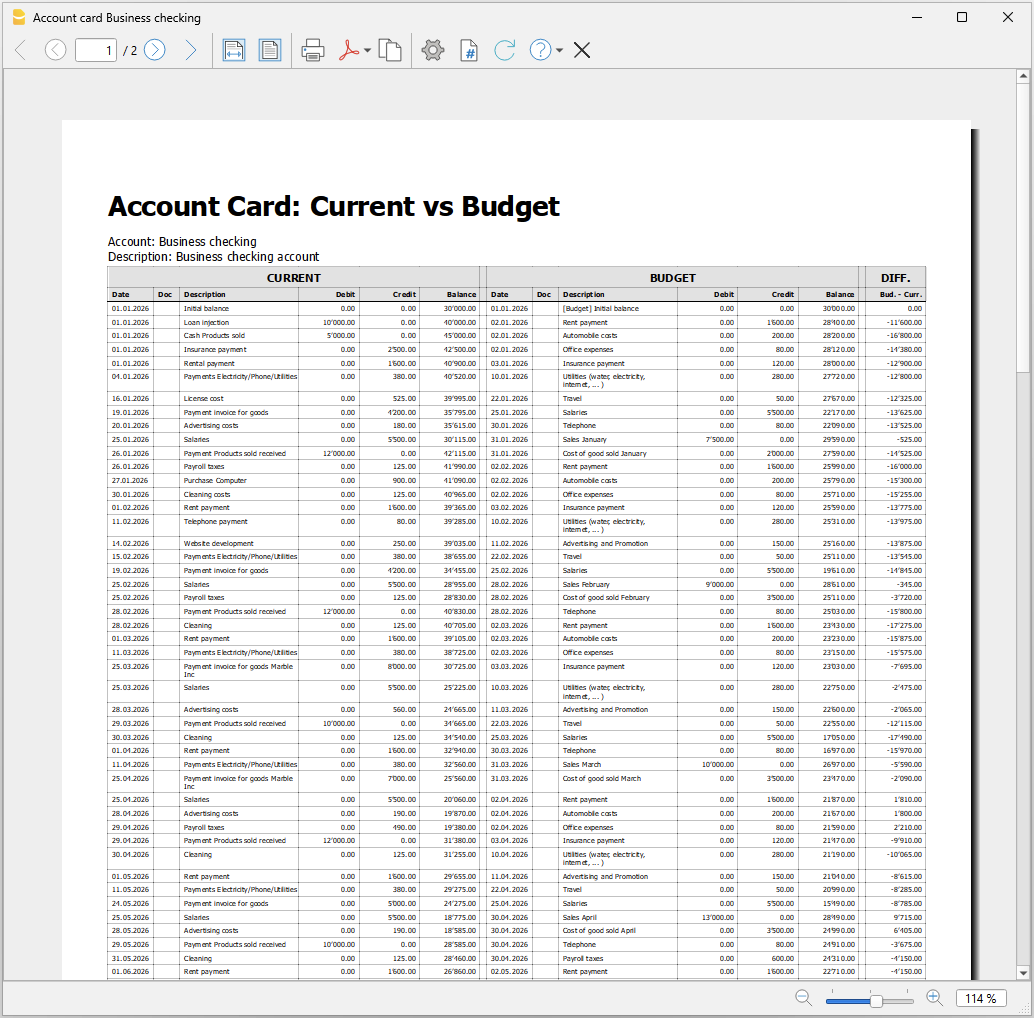
- Current account card
Displays current account card transactions with the columns Date, Document, Description, Debit, Credit, Balance. - Budget account card
Displays budget account card transactions with the columns Date, Document, Description, Debit, Credit, Balance. - Difference (between budget balances and current balances).
For each row, the difference is calculated as: Budget balance – Current balance.
This column highlights deviations between planned and actual values.
Each row or the report includes:
- current transaction (if available)
- budget transaction (if available)
- updated balance
- difference between balances
When one side has no data, the last available balance is carried forward. This ensures continuous and consistent comparison.
Report example: