In this article
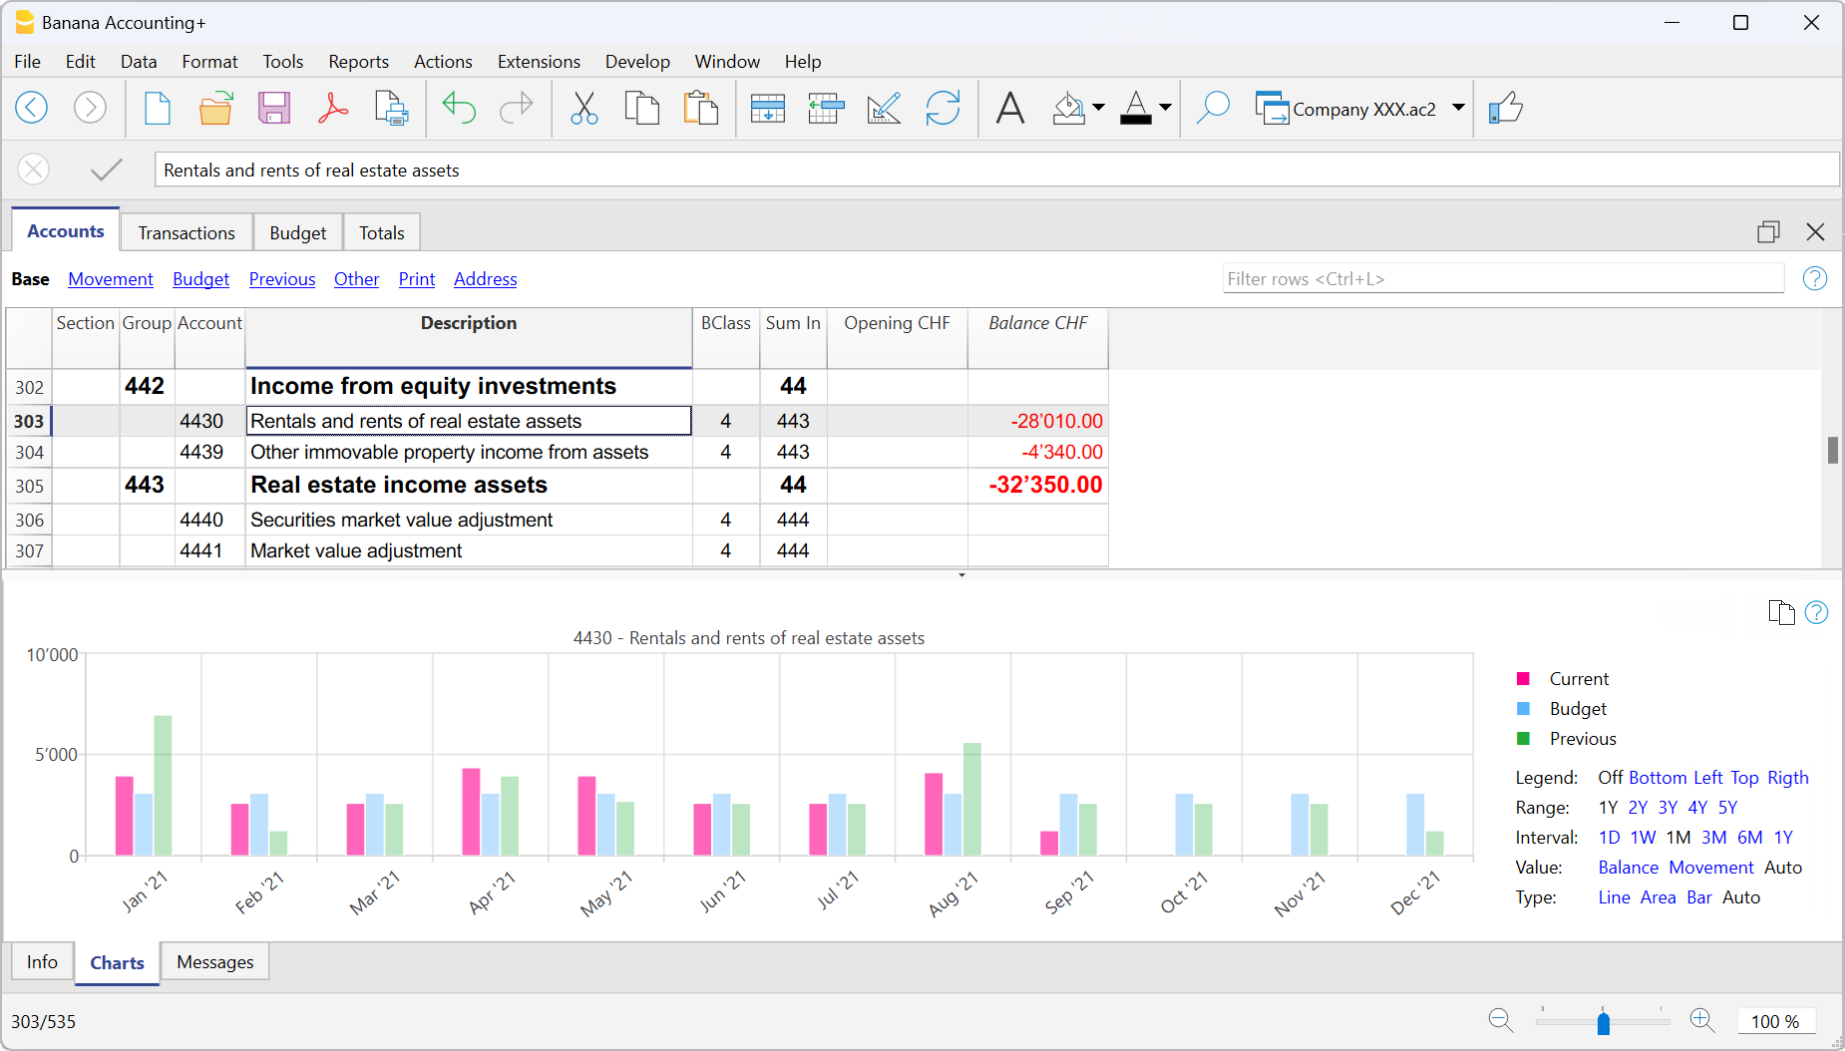
In Banana Accounting Plus, when opening a file, the Charts window is available at the bottom, which offers a graphical representation of the performance of a selected account, group, cost centre or segment.
The chart displays the data of the account or other selected item in a table, according to the settings that can be chosen in the right-hand panel:
- Placing the cursor on the curve or bar of the chart shows the exact values of the amounts.
- Clicking on a point in the chart opens the corresponding account tab at the corresponding position.
Control Panel
Using the right-hand panel it is possible to select the values and period to be displayed, the mode, as well as to print or save the chart.
If the size of the window does not allow all the controls to be displayed, only the controls concerning the legend will be displayed. To display all controls, either the main application window or the bottom window must be enlarged.
Time Values
The following accounting values can be displayed individually or simultaneously in the charts:
- Current - represents actual values.
- Budget - represents the budget values.
- Previous - represents the previous year's values.
By clicking on the name (Current, Budget or Previous) with the mouse, the respective values are displayed or hidden.
Legend
The Legend option selects whether to hide or display the legend within the chart window. As a rule it is hidden, but you can display it in case you need to print or save the chart.
- Off - The chart shows no legend.
- Low - The legend is displayed below the chart, in a central position.
- Left - The legend is displayed bottom left.
- High - The legend is displayed above the chart, in the middle position.
- Right - Legend is displayed bottom right.
Period
The period in years for which data is to be displayed.
1Y, 2Y, 3Y, 4Y, Y (Y indicates years).
Interval
The space between each value on the chart scale can be customised according to the following options:
- 1D (day), 1W (week), 1M (month), 3M (quarter), 6M (semester), 1Y (year).
Value
The chart can display the accounting balance at the end of the period or the accounting movement for the period. Depending on the selected value, the displayed date is adjusted accordingly:
- Balance - the chart shows the balance at the end of the period (e.g. 31 Jan '22 - period end date)
- Movement - the chart shows the movement of the period (e.g. Jan '22 - period)
- Automatic - the chart represents the balance for balance accounts and CC3, and the movement for income statement accounts, CC1, CC2 and segments.
Type
The chart can represent values in the following ways:
- Line - the chart is represented by lines.
- Area - the chart is represented by areas.
- Bar - the chart is represented by bars.
- Auto - the chart is represented as area for balance sheet accounts and CC3, and as bars for income statement accounts, CC1, CC2 and segments.
Print, Save or Copy the Chart
This feature is only available with the Advanced plan of Banana Accounting Plus.
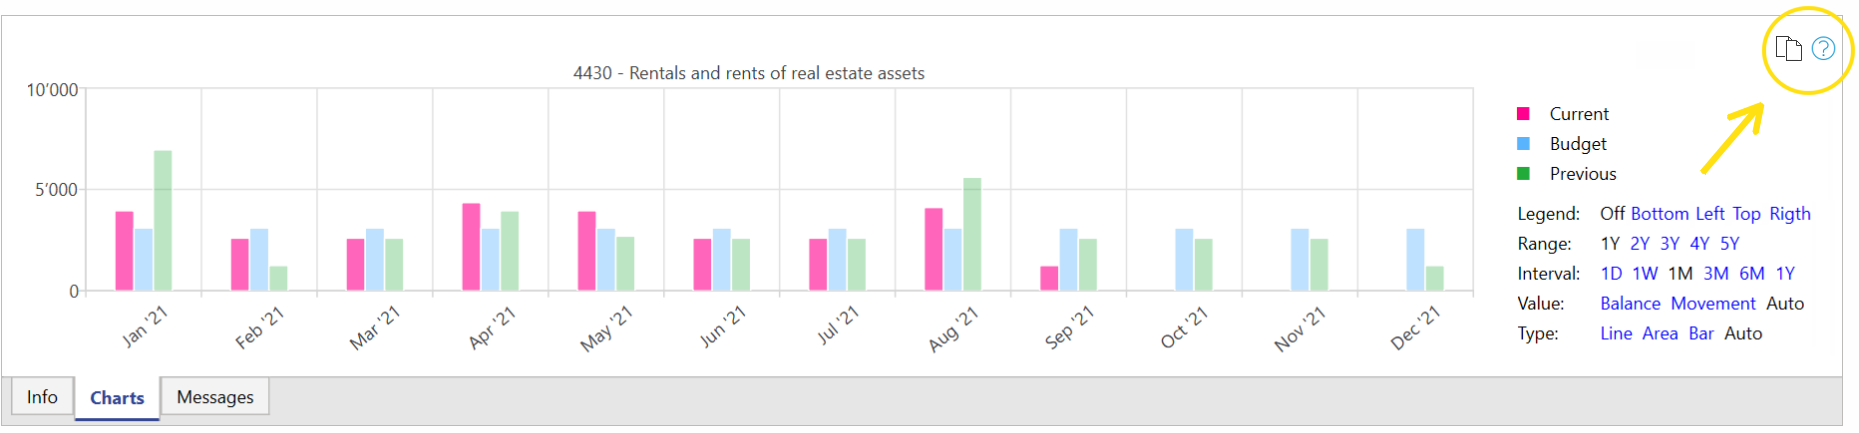
In the top right-hand corner of the chart table, clicking on the Copy symbol displays a menu with the following commands:
- Print - Displays the chart in the print preview.
- Save - Saves the chart as a PNG image.
- Copy - Copies the chart to the clipboard as a PNG image. The copied image can be pasted into any text editor (Word, Excel, ...).
- Copy Data - Copies the values used to create the chart as a data table that can be pasted into any spreedsheet (Excel, Numbers, ...).