Budget et planification financière
Budget et prévisions financières
Toutes les applications comptables comprennent un outil de prévision financière puissant et innovant basé sur la méthode en partie double. Vous pouvez facilement avoir des bilans, des comptes de résultats prévisionnels, des plans financiers, de liquidité et d'investissement.
Vision d'avenir
Les prévisions financières, selon la méthode de la comptabilité en partie double, vous donnent une vision complète de l'avenir de l'entreprise. Vous pouvez prévoir la situation avant que les choses n'arrivent, et vous aurez ainsi la possibilité d'agir à temps. Si vous constatez que les coûts seront trop élevés, vous pourrez prendre des mesures pour les réduire. Si vous constatez un manque de liquidités, vous aurez le temps de prendre des mesures pour l'éviter.
L'utilisation de prévisions financières apportera une valeur ajoutée à votre gestion.
Des prévisions financières à la portée de tous
Le système de planification basé sur la méthode de la double entrée est incroyablement puissant et abordable.
- La planification est entièrement intégrée dans le système comptable.
- Il utilise le même plan comptable que la comptabilité.
- Pas besoin de créer un nouveau dossier, il suffit d'ajouter des mouvements budgétaires.
- Les estimations sont effectuées avec des entrées de budget.
- La méthodologie comptable éprouvée de la comptabilité en partie double est utilisée. Les coûts et les recettes peuvent être spécifiés en détail.
- Vous disposez de prévisions de compte de résultat et de bilan.
- Vous pouvez voir comment les ventes, les coûts, les bénéfices, les liquidités et le capital vont évoluer.
- Vous pouvez voir l'évolution d'un compte ou d'un groupe avec tous les mouvements budgétaires individuels.
- Le programme prépare des prévisions par mois, trimestre ou année.
- Les prévisions peuvent être paramétrées avec des quantités et des formules de calcul.
- Lorsque vous modifiez les prévisions, par exemple en augmentant les investissements, l'amortissement de fin d'année est automatiquement recalculé.
- Le plan financier préparé pour un an peut également être projeté sur plusieurs années.
- Tous les rapports comptables sont disponibles avec les valeurs passées, présentes et futures.
Prévisions financières et budget simple en colonne
La fonction de planification, avec des projections financières des coûts, des recettes et des liquidités, est intégrée et disponible dans toutes les applications comptables.
Il existe deux modes de fonctionnement :
- Planification financière complète dans le tableau Budget
Le tableau Budget est ajouté au fichier comptable, ce qui permet de saisir les mouvements prévisionnels, qui servent ensuite à générer des prévisions financières complètes.
La colonne Budget du tableau Comptes est automatiquement mise à jour par le programme sur la base des mouvements saisis dans le tableau Budget. - Prévision annuelle dans le tableau des comptes
Il s'agit d'une méthode très simple et traditionnelle d'inscription des prévisions annuelles dans la colonne "Budget" du Tableau Comptes ou catégories".
Ensuite, sur la base des chiffres définitifs, le programme indique les écarts dans la colonne Différence budgétaire, tableau des comptes ou des catégories.
Voir : Budget annuel simple.
Nous nous concentrons ci-dessous sur la méthode utilisant le tableau Budget.
Vue instantanée des valeurs du Budget
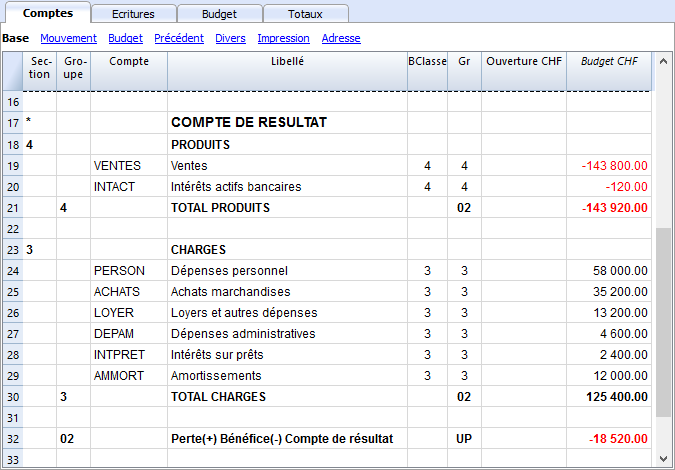
La planification financière basée sur la méthode en partie double utilise le même plan comptable que la comptabilité.
Dans le tableau Comptes et catégories (comptabilité des dépenses et des recettes), vous voyez les soldes courants ainsi que les soldes prévisionnels.
Vous pouvez définir librement la structure du bilan et du compte de résultat en ajoutant des comptes et des groupes.
Vous pouvez également utiliser des centres de coûts et de profit, des segments et des comptes pour les clients et les fournisseurs.
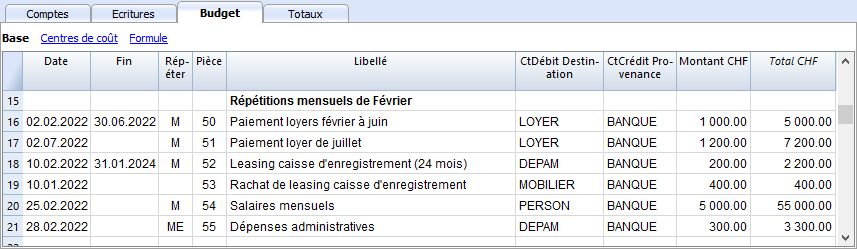
Le tableau Budget
La planification est préparée en insérant des écritures dans le tableau Budget. C'est comme faire des documents comptables, mais ils concernent l'avenir.
Le loyer et les autres opérations répétitives ne sont indiqués qu'une seule fois, en fixant l'option de répétition et une date finale possible.
La colonne Total indique la somme pour l'année.
Vous pouvez ajouter autant de lignes que vous le souhaitez, pour l'année en cours ou ultérieure, et les modifier à tout moment.
Une vision claire et complète de l'avenir de votre entreprise
Les mêmes rapports que vous avez pour la comptabilité, vous pouvez aussi les avoir pour l'avenir.
Avant même le démarrage de l'entreprise, vous pouvez connaître la rentabilité de votre entreprise et le montant des liquidités dont vous disposerez à la fin de l'année.
Aperçu complet et détaillé de votre avenir financier
Banana Comptabilité fournit tous les rapports nécessaires pour avoir une vision complète de votre avenir financier, les mêmes que ceux que vous utilisez pour la comptabilité, tous intégrés et équilibrés, sans différences, tout comme la comptabilité. Tout est automatique, vous ne devez pas perdre de temps à établir des tableaux dans Excel, à saisir et vérifier des formules, à définir des lignes et des colonnes.
- Plan de liquidité.
Vous pouvez voir comment la liquidité évoluera dans la période de planification choisie, savoir à l'avance si vous aurez suffisamment de moyens pour faire face aux différents engagements et choisir d'avoir une vue synthétique, par groupe, ou détaillée, avec chaque élément énuméré. - Compte de résultat prévisionnel.
Vous pouvez voir ce que seront les recettes, les coûts et le résultat attendu, choisir une vue sommaire avec les totaux par groupe ou même une vue détaillée avec les valeurs des différents éléments. La présentation du compte de résultat peut être établie et modifiée selon les besoins. Le programme effectuera les totaux automatiquement, sans que vous ayez à entrer des formules. - Bilan prévisionnel.
Pour chaque compte et groupe d'actifs et de passifs, vous verrez l'évolution dans le temps. - Plan d'investissement.
Pour chaque compte ou groupe d'actifs, vous pouvez voir l'évolution dans le temps. - Fiches de détails.
Vous pouvez analyser chaque élément en détail, grâce à la fiche de compte, savoir quelle sera l'évolution du compte bancaire ou des liquidités. - Graphiques avec l'évolution dans le temps.
Vous pouvez voir instantanément l'évolution future de chaque produit. D'un seul coup d'œil, vous pouvez voir comment les ventes vont évoluer ou s'il y aura une crise de liquidité. - Centres de coûts et de profits, et segments. Vous pouvez également utiliser des centres de coûts, des centres de profit et des segments lors de vos prévisions.
Vous pouvez obtenir des prévisions détaillées pour des projets individuels, des clients ou des zones géographiques. - Projections pluriannuelles.
Vous pouvez obtenir des bilans et des comptes de résultats pour un, deux, cinq ou même dix ans.
Le programme projette automatiquement les données de l'année pour les périodes suivantes. - Consulter les données par mois, trimestre, année ou plusieurs années.
Vous pouvez obtenir le bilan et le compte de résultat pour un mois, un trimestre, un semestre, une année ou plusieurs années.
Ce qui vous permettra ensuite analyser en détail la période qui vous intéresse. - Comparer le budget avec les données réelles
En utilisant le même plan comptable, la comparaison entre la prévision et la situation actuelle est immédiate. Vous pouvez facilement identifier les écarts par rapport à l'estimation. - Sauvegarder les paramètres du rapport (compositions).
Créez des rapports et enregistrez des compositions pour les reprendre quand vous le souhaitez.
Pour chaque rapport, vous pouvez choisir la mise en page qui vous intéresse. Le programme adapte automatiquement les impressions sans que vous ayez à définir des lignes, des colonnes et des formules. Vous pouvez analyser les données de différents points de vue, en passant d'un type d'affichage à l'autre.
- Affichage pour une période.
- Le programme présente des rapports pour l'année, mais vous pouvez également demander à ne disposer des prévisions que pour un trimestre. Vous pouvez facilement passer d'une planification annuelle à une planification pluriannuelle.
- Évolution dans le temps.
- Le programme est en mesure de présenter tous les rapports avec une ventilation par période. Vous pouvez voir l'évolution dans le temps des liquidités, du bilan, des ventes, des coûts et du résultat d'exploitation. Vous pouvez facilement passer d'une vue à l'autre sans avoir à réinitialiser les formules ou les tableaux.
- Rapports entièrement personnalisés.
- Vous pouvez choisir et modifier l'affichage comme vous le souhaitez. Vous pouvez présenter vos projets de manière professionnelle et faire bonne impression sur ceux qui vous soutiennent.
- Enregistrer les paramètres du rapport.
- Vous pouvez créer et enregistrer des paramètres d'impression et les rappeler lorsque vous en avez besoin.
Facile à utiliser
Tout est déjà mis en place, vous devez saisir les mouvements de prévision avec de simples écritures. Cette approche est particulièrement adaptée aux comptables, qui sont capables de faire des prévisions précises et complètes en un rien de temps. Grâce à la comptabilité des dépenses et des recettes, même les personnes n'ayant pas de connaissances particulières en comptabilité peuvent réussir.
- Saisies similaires aux écritures comptables.
Pour chaque événement financier futur, vous saisissez une entrée avec la date, la description et les comptes qui sont touchés.
C'est le programme qui totalise les montants par poste et par période, tout comme en comptabilité. - Indication détaillée des dépenses et des recettes.
Vous pouvez indiquer les différents postes de dépenses en détail et au moment exact où ils se produiront. Pour les frais de personnel, vous pouvez indiquer les salaires des différents employés. - Modifications et mises à jour facilitées.
Adapter, ajouter ou supprimer les dépenses ou les recettes devient facile du fait que vous modifiez le détail spécifique. Si le loyer augmente l'année suivante, il suffit de changer ce poste. S'il y a une nouvelle dépense, une nouvelle ligne est ajoutée. Le programme actualisera automatiquement le calendrier.
Rapide grâce aux répétitions
Les opérations répétitives ne sont insérées qu'une seule fois. Le mouvement de prédiction indique la fréquence à laquelle l'opération sera répétée et le programme en tient compte pour l'avenir. Dans un programme, il y a beaucoup d'opérations qui se répètent. Un calendrier complet peut être préparé en peu de temps. La fonction de répétition est particulièrement efficace lorsque vous devez ajuster l'horaire, changer un seul montant : en un instant tout est mis à jour.
Automatisation des calculs
Le programme effectue automatiquement des calculs simples ou complexes.
- Calcul basé sur les quantités et les prix.
Vous pouvez stocker les quantités vendues pour avoir une vue plus concrète de la planification. Le programme calcule automatiquement le montant du mouvement et met à jour la comptabilité. - Formule de calcul (Javascript).
Banana Comptabilité fournit un système de formules extrêmement puissant, conçu spécifiquement pour la planification financière. Vous avez accès aux données de planification, vous pouvez donc créer des mouvements qui dépendent d'événements antérieurs. Vous pouvez calculer l'amortissement sur la base de la valeur des investissements réalisés ou calculer les intérêts du prêt sur la base de l'utilisation réelle. Le programme recalculera les valeurs exactes après chaque changement. - Les formules sont des expressions du langage Javascript, vous pouvez créer des horaires simples ou complexes, entièrement automatisés.
- Vous pouvez attribuer des valeurs aux variables et les appeler dans les lignes suivantes.
- Les expressions Javascript ont accès à l'API Banane.
- Vous pouvez également programmer vos propres fonctions Javascript et les reprendre.
Projections automatiques sur plusieurs années
Vous pouvez fixer la planification pour une année et laisser le programme créer des projections pour les années suivantes.
Tous les rapports tels que le plan de liquidité, le compte de résultat et les prévisions de bilan seront également disponibles pour les années suivantes.
Cela vous permet d'avoir une vision à moyen et long terme de la situation financière. La projection peut également être entièrement contrôlée pour les années suivantes.
La logique de fonctionnement est simple, pour les opérations de l'année qui se répéteront également les années suivantes, un code de répétition annuelle est inséré. De cette façon, le programme est en mesure de projeter les données de planification pour la période concernée. Vous pouvez facilement planifier pour deux, cinq ou même plus de deux ans.
Analyse du portefeuille clients et contrôle des fournisseurs
Lors de la saisie des mouvements prévisionnels, vous pouvez indiquer des codes clients. Vous pouvez ainsi établir un planning réaliste à partir de votre portefeuille de clients et comprendre si les coûts seront couverts et quels clients seront plus rentables et donc plus attentifs.
La même analyse peut bien sûr être faite pour les fournisseurs.
Planification de projet ou de secteur
Vous pouvez également créer des plans financiers avec des rapports pour des projets, des activités ou des secteurs d'entreprise. Il suffit d'indiquer dans les mouvements qu'une dépense ou un revenu est lié à un projet ou à un secteur et le programme peut automatiquement préparer des rapports spécifiques.
Une adaptation facile
Vous pouvez adapter la structure du plan comptable et la présentation du bilan et du compte de résultat ; ajouter des postes et des groupes et les rapports changent automatiquement, sans avoir à ajouter des formules pour calculer les totaux des lignes ou des colonnes.
Comparer le budget et les données réelles
La comptabilité et la planification utilisent le même moteur pour le calcul et la préparation des rapports. Dans le tableau des enregistrements, inscrivez les valeurs se rapportant au passé et dans le tableau budgétaire celles du futur. Le plan comptable et la présentation du bilan sont toujours les mêmes et vous disposez automatiquement de comparaisons et d'indications sur les variations possibles par rapport au budget.
Transfert automatique des données vers une nouvelle année
Les plans préparés avec Banana Comptabilité sont faciles à mettre à jour et à modifier. Il suffit de modifier les mouvements concernés et le programme recalcule automatiquement les formules et met à jour le planning.
Lorsque vous passez à la nouvelle année, le programme communique les données de planification, en modifiant les dates. Il s'agit alors de modifier les éléments qui ont changé par rapport à l'année précédente. Cela donne une planification détaillée et parfaite pour l'année suivante.
Simulation financière d'entreprise
La planification intégrée en comptabilité est très puissante et ouvre une nouvelle ère dans la planification des entreprises, car elle donne la possibilité de simuler la série d'événements futurs avec une grande précision et dans le détail. Vous pouvez analyser les prévisions en détail avec les mêmes outils que ceux utilisés pour l'analyse comptable ; vérifier quel est le seuil de rentabilité et analyser la situation des clients ou des projets.
Apprendre la comptabilité avec la planification
En mettant en place votre planification avec des mouvements similaires à la comptabilité, vous vous exercez et apprenez la technique comptable. Les cours de formation en comptabilité peuvent être rendus beaucoup plus intéressants et efficaces, car vous pouvez confier aux étudiants la tâche de créer leur propre entreprise et la rendre solide et rentable. Les étudiants devront non seulement s'exerder à saisir des écritures, mais ils devront aussi garder un œil sur l'entreprise et s'habituer à lire le bilan et le compte de Résultat.
Commencer une planification financière
Vous pouvez facilement préparer des prévisions financières avec des plans de liquidité, un bilan et un compte de résultat.
La procédure est la même que pour la création des comptes.
1. Créer le fichier comptable/budget
Avec la commande File → Nouveau, créez un fichier de prévisions financières, en utilisant le type de comptabilité et le modèle comptable qui vous conviennent le mieux.
Vous pouvez également commencer par utiliser l'un des modèles déjà préparés pour l'apprentissage, qui contiennent également des exemples de dossiers budgétaires.
- Plan financier pour la famille (avec le livre de caisse)
Pour planifier les dépenses et les revenus de votre famille. - Planification financière pour l'ouverture d'un restaurant (comptabilité dépenses et recettes)
Ce modèle utilise des numéros de comptes alphabétiques, ce qui rend la compréhension plus immédiate.
Avec les dépenses et les recettes, même sans connaissances comptables, vous créez une planification professionnelle, avec un plan de liquidité, des prévisions d'actifs, des coûts et des recettes. - Planification financière pour l'ouverture d'un restaurant (Comptabilité en partie double)
Pour des prévisions financières complètes, avec le système de comptabilité en partie double. Destiné à ceux qui sont familiers avec la méthode de comptabilité en partie double.
Ce modèle utilise des numéros de compte alphabétiques, ce qui le rend plus facile à comprendre.
Il existe également des fichiers d'exemple pour des fonctionnalités plus avancées :
- Comptabilité en partie double, en utilisant les colonnes de quantité et les formules
Les différentes possibilités d'utilisation de la colonne des formules sont énumérées. Avec des exemples et des explications. - Comptabilité multidevise avec exemples d'écritures de budget avec formules
Utiliser des formules spécifiques pour multidevises. - Avec des exemples d'enregistrements sur des thèmes plus complexes.
Une fois créé, vous pouvez enregistrer le fichier et lui donner un nom, composé de préférence du nom de la société et de l'année "société-2020.ac2".
2. Personnaliser le dossier
Une fois le fichier créé, adaptez-le à vos besoins spécifiques :
- Définissez les propriétés du fichier.
- Le nom de la société.
- La période comptable.
Normalement, c'est celle qui correspond à l'année civile. Cependant, vous pouvez en indiquer un autre si nécessaire. Voir Période de planification et de prévision financière.
- Personnalisez le plan comptable.
Vous pouvez modifier la description, ajouter ou supprimer des comptes ou des groupes.
Si nécessaire, vous pouvez adapter le plan comptable à tout moment par la suite. - Si elle est déjà en cours, entrez les soldes d'ouverture.
3. Saisissez les mouvements des prévisions financières
Dans le tableau Budget, vous pouvez maintenant saisir les mouvements des prévisions financières.
4. Afficher le Budget
Les données de prévision sont visibles :
- Dans l'affichage graphique.
- Dans le tableau Comptes, colonne Budget.
- Dans le Rapports, colonne Budget.
- Dans la fiche de Compte, valeurs du Budget.
Adapter les prévisions
Vous pouvez modifier, ajouter ou supprimer des mouvements à volonté. Le budget sera immédiatement recalculé.
Ajouter la planification financière à une comptabilité existante
La section suivante explique comment ajouter la planification financière à un système comptable existant.
Ajout du tableau Budget
La première étape consiste à ajouter le tableau Budget à votre fichier comptable. A ce stade, vous vous trouvez avec le tableau Budget où vous pouvez entrer les mouvements des prévisions financières.
Saisie des mouvements du Budget
La comptabilité et le plan comptable étant déjà établis, vous pouvez immédiatement commencer à saisir les mouvements dans le tableau Budget, voir aussi l'exemple des mouvements.
Vous pouvez suivre les instructions et les modèles figurant dans le :
Tableau Budget
Le tableau Budgét comprend les mouvements de la planification financière. Il est similaire au tableau des Écritures de type comptable que vous utilisez, mais il comporte des colonnes spécifiques qui contribuent à accélérer et à faciliter la planification.
Vous pouvez également modifier les données comme vous le souhaitez, afin de disposer de prévisions fiables et toujours parfaitement prévisibles.
Des prévisions faciles et complètes
- Vous pouvez saisir toutes les opérations en détail.
- Vous disposez de prévisions complètes car elles sont basées sur la méthode en partie double.
- Sur la base des mouvements saisis, le programme calcule et affiche le budget.
- Indiquez quand une opération sera effectuée, si elle sera répétée et jusqu'à quand.
- Vous pouvez saisir des prévisions pour l'année en cours ou pour l'année suivante.
- Indiquez la description.
- Saisissez le compte d'origine et de destination.
- Indiquez le montant prévu.
- Ou utilisez les colonnes Quantité et Prix.
- Ou utilisez les formules de calcul.
- Vous pouvez compléter l'enregistrement avec :
- Compte client
- Fournisseurs de comptes.
- Code de la TVA
- Centre de coûts/bénéfices.
- Segments.
- Ajoutez d'autres colonnes pour obtenir des informations supplémentaires.
- Vous pouvez saisir les mouvements dans l'ordre dans lequel vous souhaitez les regrouper.
- Vous pouvez saisir des informations supplémentaires pour faciliter la présentation des rapports pour la nouvelle année.
Ajouter et supprimer le tableau Budget
La planification financière s'opère en ajoutant le tableau Budget.
Si une comptabilité n'a pas encore de tableau Budget, il faut procéder comme suit:
- Menu Outils -> Ajouter de nouvelles fonctions
- Choisir "Ajouter tableau Budget"
- Attention, cette opération ne peut pas être annulée (avec la touche Annuler). Si vous souhaitez revenir à la situation précédente, il vous faut alors, au préalable, conserver une copie du fichier existant ou utiliser la fonction Supprimer le tableau Budget.
Ensuite, le programme:
- Ajoute le tableau Budget en reprenant les valeurs du budget indiquées dans le tableau Comptes.
- Bloque la colonne Budget dans le tableau Comptes.
Les valeurs de cette colonne seront calculées selon les écritures de budget en utilisant comme période celle définie dans les données de base de la comptabilité.
Enlever la tableau Budget
Dans la commande Ajouter de nouvelles fonctions (dans le menu Outils), il est également possible de supprimer le tableau Budget.
Attention : Cette opération ne peut pas être annulée. Une fois la commande donnée, tous les mouvements budgétisés sont supprimés.
Si vous voulez revenir à la situation précédente, vous devez, au préalable, faire une copie des données.
Une fois que la tableau Budget a été supprimée, la colonne Budget du tableau Comptes peut être modifiée.
Colonnes tableau Budget
Les colonnes du tableau Budget sont similaires à celles du tableau Écritures. Dans l'exemple suivant, les comptes alphanumériques ont été utilisés pour faciliter la compréhension. Si vous avez des comptes numériques, vous utiliserez évidemment vos propres numéros de compte.
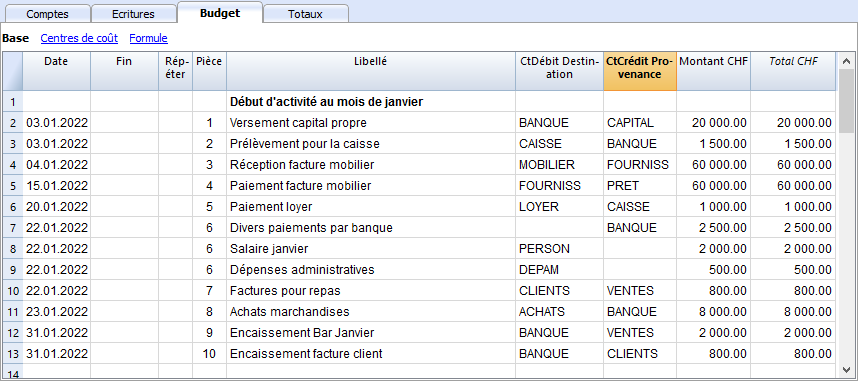
En règle générale, vous pouvez utiliser la colonne Montant pour préparer un budget.
Pour des budgets plus élaborés, il est également possible d'indiquer des quantités, des prix unitaires ou une formule. Le programme calculera automatiquement la valeur dans la colonne Montant.
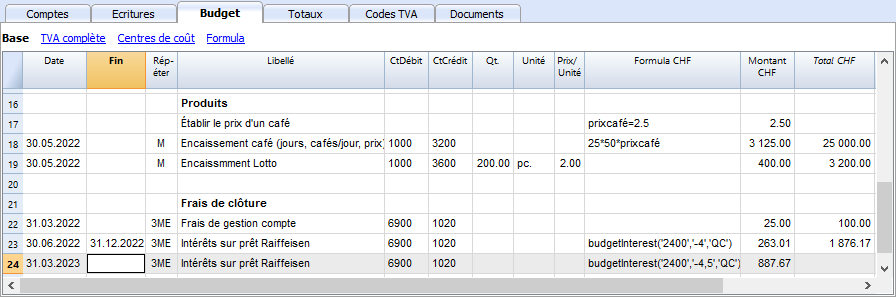
Les colonnes du budget sont expliquées ci-dessous :
- Date
Date future à laquelle l'opération devrait avoir lieu.
Si la date ne peut être définie avec précision, par exemple une prévision des ventes mensuelles, indiquez la date de fin de mois. - Répéter
Un code de répétition doit être inséré, précédé, éventuellement, d'un numéro
(3M trimestriel, 6M semestriel, 7D hebdomadaire, 3ME trimestriel fin de mois)- Vide: aucune répétition ne s'opère
- "D" pour une répétition quotidienne (Day)
- "W" pour une répétition hebdomadaire (Week)
- "M" pour une répétition mensuelle (Month)
- "ME" répétition mensuelle, mais avec une date de fin de mois
Si l'on commence avec le 28.02.2017, la date suivante sera 31.03.2017 - "Y" pour une répétition annuelle (Year)
- "YE" chaque année, mais à la fin du mois
Si la date est le 28.02.2015, la date suivante sera le 29.02.2016.
- Fin
Laisser vide ou indiquer la date après laquelle il ne doit plus y avoir de répétition. - Variante
Sert à indiquer une variante éventuelle en ce qui concerne le budget, en combinaison avec les Apps. - Pour Nouvelle Année
Sert à indiquer comment se fera le transfert, en faisant Créer Nouvelle Année.- Aucune valeur: la date augmente d'une année.
- "1" La date reste identique.
- "2" L'opération n'est pas transférée vers la nouvelle année
- CteDébit et CteCrédit, CC1, CC2, CC3
Comme dans le tableau Écritures, les comptes auxquels l'opération doit être enregistrée sont indiqués.
Les segments et les centres de coûts peuvent également être utilisés. De cette façon, vous pouvez également préparer un budget pour des segments ou des centres de coûts. - Quantité
Le quantitatif qui, multiplié par le prix unitaire, donne le totale du montant. - Unité
Une description qui se réfère à la quantité, par exemple, m2, ton, pc... - Prix/Unité
Le prix pour chaque unité qui, multiplié par la quantité, donne le total du montant.- Dans la comptabilité des dépenses/recettes il faut insérer une valeur négative pour faire en sorte que le montant sois inséré dans la colonne dépenses
- Montant (en devise de base)
Le montant à enregistrer
Au cas où il y aurait de répétitions, le montant est celui de la première écriture. Les montants des répétitions suivantes sont visbles dans la fiche de compte.
Le montant est calculé automatiquement dans les cas suivants:- Si une valeur a été insérée dans les colonnes Quantité ou Prix/Unité, le montant sera alors calculé selon le contenu de ces deux colonnes.
- Dans la comptabilité en partie double le résultat est converti en une valeur positive.
- Dans la comptabilité dépenses/recettes, si le résultat est positif il sera considéré comme recette, s'il est négatif comme dépense.
- Si une formule est insérée, alors le montant sera le résultat de la formule.
La formule a aussi la priorité sur la quantité et le prix.
- Si une valeur a été insérée dans les colonnes Quantité ou Prix/Unité, le montant sera alors calculé selon le contenu de ces deux colonnes.
- Total
C'est le total des montants des lignes répétées qui font partie de cette période comptable.
Pour afficher les différents montants, utiliser la commande Fiche Compte du menu Compta1. - Formule (en devise de base)
Permet d'insérer des formules de calcul, en langage javascript, ainsi que les fonctions de programmation des Banana Apps
Si il y a une formule (ou un texte quelconque) la valeur de la colonne Montant sera définie selon le résultat de la formule.
Voir le point suivant pour savoir comment l'utiliser.- Dans la comptabilité en partie double le résultat de la formule doit toujours être un chiffre positif.
- Dans la comptabilité dépenses/recettes, si le résultat est positif il sera considéré comme une recette, si il est négatif comme une dépense.
- Montant en devise du compte
C'est le montant en devise du compte de l'écriture (voir les écritures multidevise).
Ce montant sert au calcul de la valeur en devise de base, selon le change indiqué.
Si il y a une formule, la valeur est le résultat du calcul de la formule.
Au cas où il y aurait de répétitions, le montant sera celui de la première écriture. - Formule Montant devise du compte
Une formule de calcul peut être insérée.
Dans le cas où il y aurait de répétitions, le montant est celui de la première écriture. Les montants des répétitions suivantes sont visbles dans la fiche de compte. - Total Montant devise du compte
C'est le total des montants en devise du compte des lignes répétées dont la date fait partie de la période comptable définie dans les Propriétés fichier.
S'il n'y a pas de date ou si la date début ou fin ne fait pas partie de la période comptable, cette colonne reste vide.
Planification avec le tableau Budget
En ajoutant un tableau Budget à votre comptabilité, vous pouvez établir une planification financière complète et professionnelle.
Budget et planification financière intégrés et basée sur la comptabilité
Avec Banana Comptabilité, la planification est beaucoup plus simple et rapide, car elle s'effectue dans le programme de comptabilité.
Tout est déjà en place et en un instant, vous pouvez facilement obtenir le Compte de Résultat, le Bilan prévisionnel et le Plan de liquidité.
Voici comment procéder:
- Créez un nouveau fichier comptable à utiliser pour la planification financière.
- Personnalisez le fichier :
- Saisissez les données de base et la période.
- Adaptez le plan de compte à vos besoins.
- Saisissez les mouvements de prévision.
Apprendre en suivant un exemple existant
Pour en savoir plus, allez à la page Commencer une planification financière
Period for the financial forecast
The planning system based on the double-entry method allows you to prepare forecasts indicating when the operation will take place.
Unlike Excel, where you set up a sheet with the columns for the forecast periods (month, quarter or year), with Banana Accounting you simply indicate the expected date for the event. The assignment to a period is generated automatically by the program when it processes the data. You can decide to display forecasts by day, week, month, 2 months, quarter, semester, annual, 2, 5 or 10 years.
- Forecasts can be made for one or more years.
- Based on the data entered, the program calculates the liquidity, Balance Sheet and Income statement projections for the period in question.
- Daily forecasts can be obtained, particularly useful for liquidity, or even by month or year.
See Prints and financial forecast reports.
Accounting, planning and forecasting period
Accounting or forecasting is always relevant to a period. The following periods are differentiated:
- Accounting period
This is the one defined in the file properties, with start and end date.
Generally, it will be the same as the calendar year, but it can have any start and end date. - Planning period
The period for which the planning data is entered.- The schedule does not require a planning period to be set.
- It is generally assumed that it is the same as the accounting period.
- The planning period may be different from the accounting period. In the Budget table, rows are inserted which take effect beyond the accounting period.
- Transactions with dates outside the accounting period.
- Repetitive transactions without an end date or with an end date that is beyond the the accounting period.
- Forecast period
The period used by the program to calculate the forecast.- It is indicated when a print is requested.
- Use the accounting period as default.
- It can be set freely and in this way forecasts can be obtained for several years and even for several decades.
- The accounting period is used as the Forecast period for the calculation of the content of the Total column in the Budget table and of the Budget column of the Accounts and Categories tables.
- These values therefore refer to the accounting period defined in the file properties.
- If you change the accounting start and end date, the forecasts are recalculated.
- It is indicated when a print is requested.
Forecast with monthly logic
Forecast movements are entered in the Budget table indicating the date on which these are expected to occur. For the purpose of liquidity forecasting, it is important to indicate dates for revenues and costs as precisely as possible.
For all other income and expenses that occur on a day of the month or rather at the beginning or the end, such as rent, wages, bank charges and other expenses or income, it is important to indicate by selecting the day close to the actual day of payment.
For other revenues and expenses, approximations will be made. For example - except in special cases - for restaurant revenues, which come in daily, it is not adequate to make day-to-day forecasts. In this case it is sufficient to indicate the overall sales that are expected to occur in the month. We recommend to indicate day 15, the middle of the month.
Forecast for the current year
Movements with or without repetition are inserted in the Budget table.
The calculation of the forecast is generally generated, taking into account the movements that fall within the current accounting period, as defined in the file properties.
- The total amount for the current period is indicated in the Total column of the Budget table.
- The estimate balance for the current period is indicated in the Budget column of the Accounts and Categories table.
- In the various printouts, if it is indicated as the All period, there are forecasts for the current period.
If the file is also used to keep the accounting, the accounting period must obviously be the one referring to the accounting. Even when the file is used for forecasts only, it is better to set the accounting period referring to only one year. In fact, if a period of two years is entered in the base data, the values of the forecasts, in the Total and Accounts column, will be for the two years. This can lead to confusing values.

Forecasts over several years
If you insert the forecast movements with a repetition code, the program is able to prepare forecasts that extend beyond the defined period.
To obtain forecasts over several years, the movements are entered in the Budget table.
- Opening balances
- These are inserted in the Accounts table.
- Forecast movements prior to the accounting period.
- For special cases, it is also possible to insert transactions with dates prior to the accounting period.
- Attention must be paid, because these operations will change the balances at the time of opening.
- For these transactions, the Total column will be empty because it is outside the accounting period.
- Forecast movements for the accounting period.
- Movements are indicated with the date falling within the accounting period.
- If there are operations that will also repeat in the following years, the annual repetition code must be set to "Y".
- If the repetition of the operation occurs during several years, indicate the number of years before the Y, i.e. for every 2 years indicate "2Y", 5 years "5Y", 10 years "10Y".
- If the repetition does not extend beyond a set date (for example the payment of a lease), the end date must be indicated.
- Forecast movements for the following years.
- The future date, on which the transaction is expected is indicated.
- The repeat code and the end date can be indicated.
- For these transactions, the Total column will remain empty because they are outside the accounting period.
Use of formulas
The formulas allow you to automate amortization and interest calculations. When an investment increases, the income statement is also immediately updated. Formulas are especially useful when making forecasts over multiple years.
You can use the formulas to automatically adjust the amount in the repeat rows .
- The calculation of depreciation can be based on the balance of the fixed assets account.
- Interest can be calculated directly on the bank account movements.
- You can determine a sales progression.
- Purchases can be defined as a percentage.
Print with the forecast period
Thanks to the fact that movements with the repetition code or with the dates of the following years have been inserted in the Budget table, the program is able to calculate forecasts for future years.
When the report is printed, indicate the start and end date in the Period section.
Considering that the start date is January 1, 2022:
- If you want a 2-year forecast, indicate the end date as 31 December 2024.
- If you want a 5-year forecast, indicate the end date as 31 December 2027.
- If you want a 20-year forecast, indicate the end date as 31 December 2042.
The possibility of getting a forecast is available for the following printouts:
All accounting reports can contain accounting values, forecast values, or both together. The parameters available are the same for accounting reports and forecasts.
Thanks to these reports, you may generate a Provisional Balance Sheet, Provisional Income statement, Liquidity planning, Investment planning, Financing planning and more, for future interest periods .
Columns divided by period
In the Subdivision section you can use the program to create columns for the period.
You can thus display the evolution by month, quarter or year.
With Composition you can set up print formats and call them up again later. If you run forecasts over several years, it is will be useful to have pre-set compositions, overall, per year, 5 years or with the comparisons between the final balance and the estimate, which can be called up immediately .
Budget - Three-year forecast
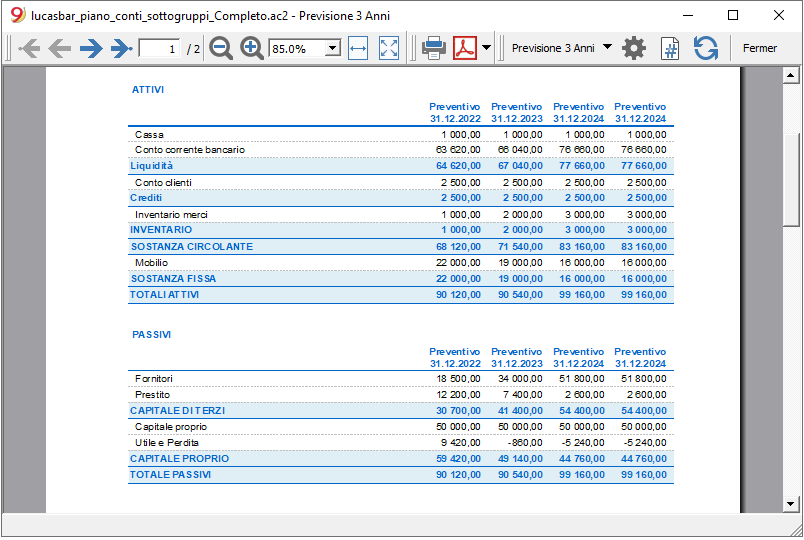
Income statement - Three-year forecast

Budget transactions
When preparing financial forecasts, based on the double-entry method, transactions are entered in the Budget table. Indicate origin and destination accounts for each one. The program has the information necessary to prepare Balance Sheets and Income statements, that will however relate to the future and not the past.
When one is planning with Excel, the Income statement is set up first, then the revenues and costs are listed. Generally, the liquidity and investment plan is prepared only later and on separate sheets.
When making forecasts with the double-entry method, we proceed instead as if we were keeping an accounting for the future. All the transactions that are expected to occur will be listed. The program will then automatically prepare the Balance Sheet and Profit and Loss account for the indicated period or periods.
Structuring of budget transactions
For the preparation of a financial plan, we generally proceed by listing the different elements in the following order:
- Capital injections.
- Third party capital injections.
- Setting up expenses.
- Investments.
In furniture, equipment. - Recurring fixed costs.
Rent, staff, social security charges, energy, subscriptions. - Recurring revenues.
- Variable revenues
The turnover which is typically seasonal. - Variable costs.
Commissions, costs of the goods sold and others, which are related to the expected volume of revenues. - Year-end transactions.
Depreciation, taxes, interest on loans, dividends.
By the time you enter sales and variable costs, you will already have the cost and capital structure. It will be possible to know instantly, whether the expected turnover will allow the company to generate sufficient profits and liquidity to guarantee its sustainability over time.
Amount and Formula column
As a rule, to prepare a budget, simply use the Amount column.
For more elaborate estimates, there is the possibility of indicating quantities, unit prices, or a formula. The program will automatically calculate the value in the Amount column.
Updating forecasts
With the double-entry method, thanks to the possibility of indicating each operation in detail, it becomes easier to update and improve the forecast. Initially, estimates of different costs or investments will be entered. As you get closer to the operational phase and there will be more precise data, just replace the existing ones. Even when the activity has started and exact elements are known, the forecast can be updated easily. Precise and reliable indications on profitability and liquidity are thus available.
Dates and repetitions in financial forecast transactions
The Data column
The value contained in the Data column is the one that will validate the forecast.
- If there is no date, the transaction will be taken into account at the beginning of the planning.
If you require a forecast indicating a period, the amounts will be taken into account in the balance value at the beginning of the period.
Due to the fact that it does not fall within the period, no amount will be displayed in the Total column. - Dates in the accounting period set in the file properties.
These are the ones commonly used. The total amount will be indicated in the Total column, taking into account repetitive movements, within the accounting period. - Dates prior to the period.
You can enter movements that precede the forecast period. However, you must be careful that they do not conflict with the opening balances entered in the account table.
Due to the fact that it is not within the period, no amount will be displayed in the Total column. - Dates after the period.
If you make forecasts over several years, they allow you to indicate transactions for the years to come.
Due to the fact that it is not within the period, no amount will be displayed in the Total column.
The End date
This is used in combination with repetition, to indicate the last date beyond which there is to be no repeat.
- Must generally be left empty.
If you enter a date when it is not necessary (for example the end of the accounting period) the forecasts for the following years will not include this operation. - For leasing transactions.
Indicate the date on which the payment of the last installment will be made as the end date. - For loan repayment.
Indicate the last expected payment date. - For changes in the amount at set deadlines.
In the case, for instance, that the amount of a recurring transaction is adapted at certain deadlines (salary increase).- Create a transaction row with repeat "M" and End date as per the last payment before the increase.
Create transaction rows with Data when the increase begins. - If the increase follows a precise and regular automation, this can also be programmed with formulas.
- Create a transaction row with repeat "M" and End date as per the last payment before the increase.
Repetitions
For recurring expenses or income, the repetition code is recommended (refer to Documentation on the columns).
- When calculating the forecast, the program creates copies of the operation and progressively increases the date, taking into account the indicated frequency.
- If there is no end date, the program will generate internal copies of the records for the entire period of the forecast indicated at the time of the report when calculating the forecast.
- If the start date is January, the frequency is monthly
- If the forecast period is the year, it will generate rows from February, 1 original row and 11 automatic rows, for a total of 12.
- If the forecast period is 10 years, it will generate rows starting from February, 1 original row and 119 automatic lines (11 the first year + 12 * 9 for the following ones), for a total of 120 lines.
- If the start date is January, the frequency is monthly
- If you want the program to automatically calculate forecasts for subsequent years.
- For recurring operations, indicate the relative repetition code.
- For transactions that occur only once a year (for example depreciation at the end of the year), indicate the repetition code "Y", so that the depreciation is also calculated in the following years.
- Don't use the repetition only if the operation will not occur in the following year.
Total column of the Budget table
The Total column is calculated automatically and represents the sum of the amounts of the current row and the repetition amounts that fall within the accounting period. The Total column is empty if the transactions have an earlier date or extend beyond the accounting period.
Schedule with precise date and monthly logic
Forecast movements are entered in the Budget table indicating the date on which these are expected to occur.
However, it is not always possible to predict all revenues and expenses with a daily precision. When making a forecast it is therefore useful, in some cases, to use approximations, generally reasoning on a monthly basis. In any case, it is useful to always follow a specific logic so that reliable liquidity forecasts can also be obtained in the short term:
- Punctual operations (capital payment, investments) are indicated with the date on which they are expected to occur.
If there is no precise date, it is useful to indicate them on the 15th day of the month in which they are expected to occur. - Recurring charges that have a precise payment date are to be set with the expected payment date and the relative repetition code:
- Bank charges, interest, amortization are to be indicated at the end of the month, quarter or year that they will take place.
- Rentals on the due expected date of payment.
- Salaries and social security charges
- For the calculation and monthly payment on the day that wages are paid.
- For thirteenths, bonuses or whatever at the moment they are paid.
- Payments for advances and adjustments of social security charges on the expected payment date.
- Payments and VAT adjustments on the typical payment due day.
- Revenue Forecasting.
The preparation of the forecasts depends on the type of activity.
If you do not know the exact day, but you will know that it will happen in a certain month, it is recommended to indicate the 15th of the month- Punctual revenue.
They are to be indicated on the date on which it is expected to take place or mid-month. - Recurring revenue.
To be indicated on the date of entry or mid-month. - In many cases a monthly forecast is well suited. The revenue can be indicated on the 15th of the month.
- If the revenues are recurring, the revenue can be entered with the monthly repetition. Using formulas you can predict growth.
- If there are seasonal differences, it is helpful to have a sales forecast row for each month.
- Forecast of projects or major works.
If there is a calendar with receipts, a transaction row is to be indicated for each expected entry. It can be approximated by indicating the 15th of the month. - Forecast for customers.
For a consultant or commercial advisor, who works both with budgets and projects, it can prove very useful to set up a detailed revenue forecast for each client, with the expected payment dates. This forecast will also be very useful to check if the customer has actually paid.
- Punctual revenue.
- Variable costs.
- Constant expenses linked to the turnover (a restaurant for example ), are indicated with the same date as the turnover. With a formula you can also calculate as a percentage value of the turnover.
- Costs can also be linked to other elements, such as the number of employees, rented premises or other.
Forecasting with the cash principle
Planning for small business and cash activities (such as shops, restaurants) it is useful to proceed with the cash principle, then indicate the revenues with the date on which they will be collected and the costs when paid.
For important operations, such as the purchase of a machine whose payment is deferred over time, it is however useful to insert forecast movements with precise details:
- Purchase of machinery (asset registration with suppliers) with date of purchase.
- Payment of the machinery, with the date(s) on which payment is expected.
Forecasts with the accrual method
In this case, the insertion of the operations takes into account when the payment will be made.
- Cash transactions.
They are obviously registered normally. - Transactions expected to be settled in the near future.
For simplicity, the operations that fall within the forecast month or the one immediately following, it can be useful to use the cash principle. - Deferred payments.
If the dates are not known with precision, you can use the 15th of the month.- Transactions with precise payment terms.
- One movement indicates the purchase date with the counterpart in the supplier account.
- One of the other movements indicates payment on the scheduled dates.
- Transactions with precise payment terms.
- Deferred collections.
- With precise payment terms, as is the case with a project:
- A movement indicates the billing date and the customer account with the counterpart.
- One of the other movements indicates payment on the scheduled dates.
- Late payment.
This is the case when a part of the revenues is collected in the short term, a percentage is collected later. It can be done like this:- Enter the revenue as cash collection.
- With the same date, a movement is created that moves a part of the collection to the customer account.
- At a later date, the cash collection is indicated with the client account of the counterpart.
- With precise payment terms, as is the case with a project:
- Use of variables for deferred collections and payments( see Example use of variables)
When the same value must be reused at the time of payment, it can prove very useful to use the formula column and variables.- In the billing transaction, the amount is assigned to a variable.
- In the payment movement, the variable is inserted so that the amount is automatically taken over.
- Variables can also be used to define the percentage of the amount that will be deferred, for example.
Esempi di movimenti di previsione finanziaria
I movimenti di pianificazione si inseriscono come delle normali registrazioni, con la data descrizione, importo, conto dare e avere.
In più si usa però il campo ripetizione, che consente di inserire le operazioni ricorrenti con una riga sola.
Qui di seguito sono elencati diversi esempi ripresi dal modello seguente a cui si rimanda per ulteriori spiegazioni.
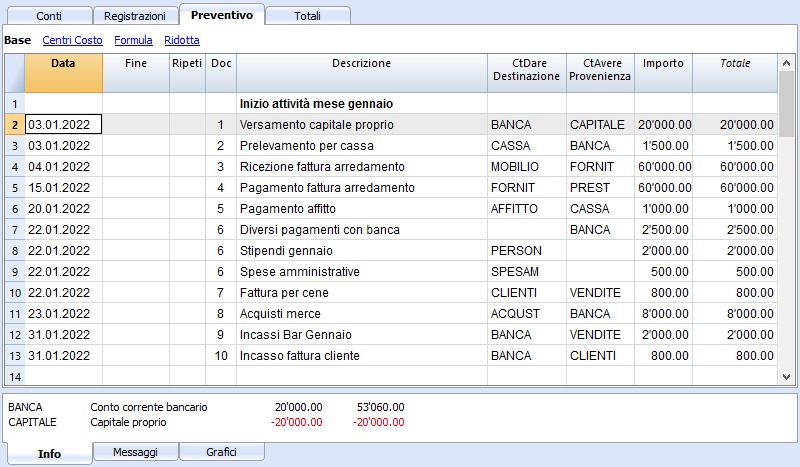
Normali registrazioni di previsioni
Si tratta di registrazioni di previsione che sono come delle normali registrazioni.
L'esempio qui indicato è riferita all'inizio dell'attività, quindi operazioni che non si ripetono.
Registrazioni ripetitive mensili
Qui di seguito degli esempi di registrazione con ripetizione mensile, codice "M". La colonna Totale indica l'importo complessivo per l'anno.
Le prime due registrazioni si riferiscono all'affitto, che da febbraio a giugno è di 1'000 mensile, mentre da luglio è di 1'200.
C'é anche una data 2025, che è l'importo che si dovrà versare per il riscatto del leasing. In questa riga non vi è nulla nella colonna Totale, perché il movimento non rientra nelle date del periodo contabile definito nelle proprietà file.
Per le spese amministrative conteggiate dalla banca si è usato il codice ripetizione "ME" Fine mese (Month End). Per le registrazioni successive non sarà usato il giorno 28, ma l'ultimo giorno del mese, quindi marzo 31, aprile 30.

Fine trimestre
Qui indichiamo alcune registrazioni tipiche che si ripetono a fine trimestre. Inseriamo la ripetizione 3ME, che significa ripeti ogni 3 mesi, con data fine del mese.

Fine Anno
A fine anno ci sono delle operazioni. Qui usiamo il Ripeti "Y" in modo che queste operazioni saranno eseguite anche per gli anni successivi.

Previsione ricavi e acquisti merce
La previsione dei ricavi è specifica a ogni attività. In questo caso la previsione dei ricavi e degli acquisti viene indicata mese per mese, con un importo specifico.
A partire da marzo è indicata la ripetizione "Y" annuale, così che queste operazioni saranno ripetute negli anni successivi.

Ricavi anno successivo
I mesi di gennaio e febbraio nel primo anno di attività non erano considerati significativi per gli anni successivi, quindi non avevano una ripetizione.
Per i primi due mesi del secondo anno dobbiamo impostare le vendite. Mettiamo anche la ripetizione "Y" annuale così verranno ripetute l'anno successivo.

Forecasting with quantity and price
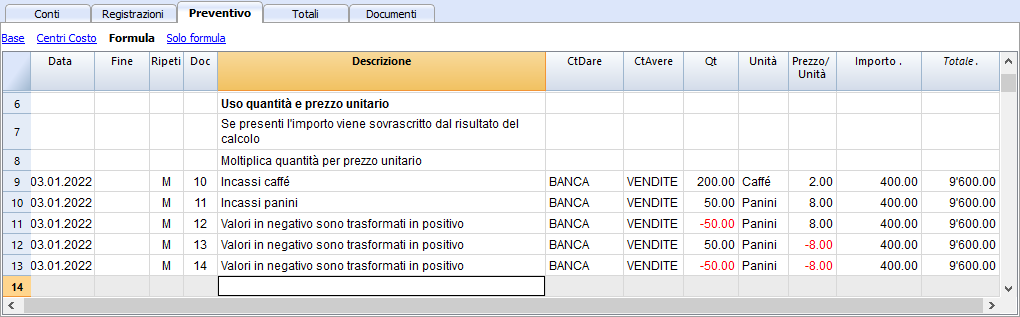
The Quantity, Unit and Unit Price columns of the Quotes table allow you to prepare forecasts faster.
The value of the Amount column is calculated by the program by multiplying the Quantity by the Unit Price (under the condition that Formula column is empty).
The Quantity, Unit Price columns are set as visible in the Formula View.
Advantages of using the Quantity and Prices columns
The quantity and price columns are useful for making predictions based on quantities. For example:
- In the Unit column you can indicate what the price refers to.
- The Quantity column indicates the number of seats served daily.
- The Price column indicates the estimated revenue for each cover.
- The Amount column will be calculated automatically based on the values indicated.
With this approach offers several advantages:
- All elements of the planning can be precisely detailed in the Budget.
- We remember the quantities and prices used to make the estimate.
- Changing the schedule is very simple, you can change the element you want only.
- How the profit varies, can be seen with a change in the quantities sold or in the price.
Break-even analysis.
Calculs et formules
Fonctions pouvant être utilisées dans la colonne Formules du tableau Budget
Fichiers d'exemple:
Pour des exemples concernant les formules, reportez-vous aux explications suivantes :
- Modèle des écritures avec l'utilisation des colonnes quantité et formule
- Modèle des écritures pour la comptabilité multidevise qui utilisent la colonne formule pour la devise de base

Colonne Montant
À des fins de planification, la valeur de la colonne Montant fait défaut.
La valeur dans la colonne Montant :
- Peut être saisie manuellement.
- Peut être le résultat d'un calcul :
- Si une quantité et un prix sont saisis, le montant sera le résultat de la multiplication de ces valeurs.
- S'il n'y a que la quantité ou le prix, le montant sera 0.
- Si une formule est saisie, le montant sera le résultat de la formule.
- La formule a également la priorité sur la quantité et le prix. S'il existe une formule, le contenu des colonnes Quantité et Prix n'est pas pris en compte.
Insertion de formules de calcul
Langage Javascript
La formule doit être exprimée en langage Javascript (à ne pas confondre avec le langage Java).
S'il existe une formule (ou un texte quelconque), la valeur de la colonne Montant est définie en fonction du résultat de la formule.
Vous pouvez utiliser toutes les fonctions du langage Javascript, plus les API fournies par Banana.
Séparateur de décimales
Javascript utilise uniquement le point "." comme séparateur de décimales.Si vous utilisez un séparateur différent, celui utilisé pour les nombres dans le format local, il est probable que le nombre sera tronqué.
Séquence de calcul et absence de valeurs futures
Comme expliqué ci-dessous, les lignes sont triées par date et résolues en commençant par la plus basse.
S'il y a des opérations avec la même date, l'ordre est celui du moment de la saisie.
Lorsqu'une ligne est résolue, il n'y a que les résultats des lignes précédentes. Les lignes suivantes n'ont pas encore été traitées, de sorte que dans la formule de budget, vous ne disposez que des valeurs jusqu'à ce moment.
Le résultat de la dernière opération est repris.
La valeur saisie dans la colonne Montant est le résultat de la dernière opération effectuée.
- 10*3 //sera retourné 30
- S'il y a plusieurs opérations en séquences, séparées par des points et virgules ";" la dernière opération sera reprise.
10*3;7; // C'est le 7 qui sera repris - S'il y a un retour, la valeur est reprise après le retour.
retour 10; // C'est le 10 qui sera repris
Variables automatiques
- budgetCurrent
C'est un tableau qui contient les lignes du Budget juste après la création des répétitions.
Elles sont utilisées pour reprendre les valeurs, en conjonction avec le JReapeatNumber. - DEBUG est une variante qui peut être "true" ou fausse.
Si "true", tous les résultats des formules sont affichés dans les messages. - row
C'est un objet javascript qui fait référence à la ligne courante.
Les valeurs des cellules peuvent être reprises avec la fonction value ("columnNameXml").
row.value("date") retourne à la data de l'écriture.- row.value ("JRepeatNumber") retourne le progressif de la répétition.
La première répétition est 0.
- row.value ("JRepeatNumber") retourne le progressif de la répétition.
Fonctions Budget
En plus de l'API budget défini dans l'API de classe comptabilité, il existe des fonctions spécifiques.
budgetExchangeDifference(account,[date, exchangeRate])
Cette formule rappelle la fonction Banana.document.budgetExchangeDifference.
budgetGetPeriod(tDate, period)
Cette fonction est utilisée en combinaison avec l'utilisation de la répétition.
Lorsque des répétitions sont indiquées, il est conseillé de se référer à une période de calcul et non à une date précise.
Paramètre tDate. Date à laquelle le calcul de la période se réfère. En règle générale, la date de la ligne d'écritures.
- Paramètre period.
Un sigle- "MC", "QC", "YC" pour indiquer le mois, le trimestre ou l'année courant.
- "MP", "QP", "YP" pour indiquer le mois, le trimestre ou l'année précédente.
- Valeur de retour.
Un objet composé de deux dates- startDate
- endDate
// example
t = BudgetGetPeriod ('2015-01-01', 'MP') retourne
t.startDate // 2014-12-01
t.endDate // 2014-12-31
Fonctions budgétaires spécifiques
Ce qui suit est similaire aux fonctions disponibles avec Banana.document, mais peut être utilisé sans indiquer l'objet Banana.document.
A tenir compte:
- Au lieu du paramètre startDate, vous pouvez utiliser une des abréviations "MC", "QC", "YC", "MP", "QP", "YP" expliquées dans le budgetGetPeriod.
- Si un sigle est spécifié comme date, la date de l'écriture en cours est utilisée.
- L'utilisation de la date de fin n'a de sens que si elle est antérieure à la date de la ligne
Si elle est égale ou supérieure, elle n'aura aucun effet car les valeurs après la ligne courante ne sont pas encore disponibles, car elles n'ont pas été traitées.
Liste des fonctions disponibles dans tous les comptabilités :
- budgetBalance(account, startDate, endDate, extraParam)
Le solde jusqu'à la ligne courante.
budgetBalance('1000', 'MP'); //retourne le solde de 1000 à la fin du mois précédent - budgetOpening(account, startDate, endDate, extraParam)
Le solde au début de la période. - budgetTotal(account, startDate, endDate, extraParam)
La différence entre les mouvements Débit et Crédit de la période
budgetTotal('1000', 'MC'); //Retourne le mouvement total du compte 1000 pour le mois courant - budgetInterest( account, interest, startDate, endDate, extraParam)
Calcule les intérêts sur un compte, pour la période indiquée (au maximum la date du jour)
Si vous utilisez pour calculer les intérêts sur un compte de fin de période, la ligne où la formule est affichée doit toujours être la dernière pour cette date.- Paramètre intérêt,
Indique le taux d'intérêt en pourcentage.- positif (2.5, 4, 10) calcule les intérêts sur le mouvement Débit du compte.
- négatif (-2,5, -4, -10) calcule les intérêts sur le mouvement Crédit du compte.
- Paramètre intérêt,
Fonctions pour la comptabilité multidevise :
Ils peuvent également être utilisés pour la comptabilité sans multidevise, dans ce cas le compte est toujours dans la devise de base.
- budgetBalanceCurrency(account, startDate, endDate, extraParam)
Le solde dans la devise du compte jusqu'à la ligne courante. - budgetOpeningCurrency(account, startDate, endDate, extraParam)
Le solde dans la devise du compte jusqu'à la ligne courante. - budgetTotalCurrency(account, startDate, endDate, extraParam)
crédit(montant)
-
Si le paramètre montant est négatif, il retourne le montant comme valeur positive.
credit(-100) // retourne 100 - Si le paramètre montant est positif, il retourne 0 (zéro)
credit(100) // retourne 0
Cette fonction est utile en liaison avec la fonction budgetBalance seulement sur les soldes nécessaire.
Si vous voulez calculer le pourcentage sur les ventes, l'utilisation de cette fonction est plus facile.
credit(budgetTotal('1000')) // insère la valeur que si elle est négative.
debit(montant)
-
Si le paramètre montant est positif, il retourne le montant.
debit(100) // retourne 100 - Si le paramètre est négatif, il retourne 0 (zéro)
debit(-100) // retourne 0
Utile si vous devez faire des calculs en utilisant seulement le montant du Débit en évitant d'utiliser celui du Crédit.
Include
Inclut et exécute un fichier javascript, avec la possibilité de créer des fonctions spécifiques et des variables qui peuvent être rappelées dans le script.
- inclure "file:test.js"
Exécute le contenu du fichier indiqué. Le nom est relatif au fichier sur le quel l'on travaille. - inclure "documents:test.js"
Exécute le document texte contenu dans le tableau documents
Doit être un fichier de type "text/javascript"
Variables
Il est possible de définir et d'utiliser des variables directement à l'intérieur des lignes.
La variable doit pour autant avoir été définie au préalable.
price = 10;
total = price * 5;
Fonctions définies par l'utilisateur
L'utilisateur peut définir des fonctions avec le langage javascript et les rappeler dans les formules.
Il est possible de définir des fonctions:
- Directement dans une formule
- A l'intérieur d'un fichier attaché du type code javascript, indiqué dans un document qui a comme ligne id le nom "_budet.js"
- A l'intérieur d'un texte dans le tableau documents et inclu avec la commande inclure.
function calcolaImposte(utile)
{
   var aliquota = 10;
   if (utile > 50000)
      aliquota = 10;
   else if (utile > 100000)
      aliquota =20;
   return utile * aliquota / 100;
}
Séquence de calcul et de recalcul
Chaque fois qu'une valeur dans la tableu Budget est modifiée ou que l'on fait un nouveau contrôle manuel (Maj. +F9), le programme:
- Si il existe, le contenu du document "_budget.js" vient avant tout.
- Recalcule les lignes du tableau Budget:
- Le programme génère les lignes répétées sur la base de la colonne Date début, Date fin et Répétition.
Si en janvier il se trouve une ligne avec répétition mensuelle, 12 lignes identiques seront créées, mais avec la date per chaque mois de l'année. - Les lignes du budget sont donc élaborées par ordre de date (si elles ont la même date dans l'ordre d'insertion.)
- Le calcul du montant de l'écriture sera calculé sur la base de la quantité et du prix unitaire ou si il y a une formule, sur la base du résultat de la formule.
- Pour la comptabilité multidevise c'est d'abord la formule Montant en devise qui sera exécutée et ensuite la formule Montant en devise de base.
S'il n'y a pas de formule Montant en devise de base, le programme reprendra le change historique et calculera l'équivalent en devise de base. - Pour la comptabilité avec la TVA, la TVA est calculée sur base au montant de l'écriture
- Les lignes élaborées précédemment servent pour les calculs des lignes suivantes.
Les soldes des comptes à la date de la ligne du budget contiendront seulement les montant élaborés précédemment.
Si dans une écriture de février on utilise une formule pour le calcul du solde pour toute l'année, on n'aura quand même que le solde jusqu'à février.
- Le programme génère les lignes répétées sur la base de la colonne Date début, Date fin et Répétition.
- Recalcule les valeurs du budget dans le tableau comptes, sur la base des lignes de budget et des soldes initiaux.
- La valeur de la colonne total est mise à jour dans le tableau budget.
Si la date de début/fin de la comptabilité est modifiée, ou d'autres valeurs qui sont nécessaires pour le calcul des valeurs du Budget (par exemple, le tableau TVA), il faut recalculer la comptabilité manuellement (Commande Contrôler la Comptabilité)
Si vous avez beaucoup de lignes avec beaucoup de répétitions, ainsi qu'une une longue période de calcul, le recalcul du tableau Budget pourrait rallentir la saisie. Dans ce cas, il faudrait activer le recalcul manuel dans les propriétés du fichier.
Examples of the use of formulas in financial forecasts
Below you will find some examples of how to use formulas to automate financial forecasts.
Please refer to the specific documentations:
- Javascript formulas in the Budget table
- Templates with transactions using the Quantity and Formula column

Parameters
When planning, it can be useful to define variables that can and will be used later.
It is useful to create a parameter section with a posting date of January 1st, or another date that corresponds to the first day of the Budget. The parameter variables will then be used in the following rows.
// 30%
costOfGoodsSold = 0.3
// 5%
interestRateDebit = 0.05
// 2%
interestRateCredit = 0.02
// 10 %
latePaymentPercentage = 0.1
This way, all parameters that can be set are displayed instantly. When a parameter is changed, the forecast is recalculated.
Repetitions or values per month
By using the repeat column, you can plan for the whole year on one recording row.
If however, the activity has seasonal variations, it is recommended to use a forecast by month. For each month, a row is created with the sales amount for the month.
If you wish to make forecasts automatic for several years, it is useful to insert the repetition "Y" in this row, so that the row of the year is also used for the next one.
Prices and sales quantities
When making a sales plan it will be easier to enter values using the quantity and price column. For example, a restaurant can enter the number of covers served per day, week or month and the program automatically calculates the amount. By changing the number of covers or the price, the impact on liquidity and on the result for the year is instantly displayed.
Use of formulas with variables for growth
Use formulas, which are expressed in the Javascript language:
- The variable must be defined before being used, hence the line, in which it is defined, must be a date preceding the the line in which it is used.
- Thousands separators in numbers can't be used.
- The decimal separator is always the "." (Full stop)
- The names are different for uppercase / lowercase.
You can assign a value to a variable (this name can be freely chosen) and enter the variable name in the following lines to resume the value.
By changing the value assigned to the variable, all the lines, in which the variable is used, are automatically modified.
As an example, you may set the expected sales amount, proceeding with the following months, by using a formula to increase the amount.
- Create a "S" (sales) variable , by entering the following text in the Formula column.
Sales=1000
The value 1000.00 will be inserted in the amount column - In the following lines use the variable by simply inserting the variable name in the formula:
Sales
The value 1000.00 will be inserted in the amount column - You can add 10% to the amount (multiplying by 1.1)
Sales*1.1
The value 1100.00 will be inserted in the amount column (The value of the Sales variable does not change) - You can increase the value of S
Sales=Sales+200
The value 1200.00 will be inserted in the amount column (The value of the Sales variable will change) - If the variable is used in the following line, there will be the new calculation
Sales
The value 1200.00 will be inserted in the amount column
You can also define a variable to define the percentage of growth.
- Percentage=1.1
- Amount=200
- In formulas you can use the variable name instead of the number
- Sales*Percentage
- Sales=Sales+Amount
Variables and repetitions
Let's say you expect the turnover to rise by 5% every month.
- Enter two lines where you assign the value to the variable, without putting any account with the start date of the year.
Sales=1000
Increment=5 - Then create a line with the repetition where you enter the accounts and the formula
Sales=Sales*(1+Increment/100)
Each time the row is repeated the value of the variable S will be increased by 5% and consequently also the amount of the transaction. By simply changing the growth percentage, the forecast will be recalculated.
In a row you can also insert multiple Javascript instructions, by separating them with a semicolon ";"
Sales=1000; P=5
Use of budget formulas
There are functions that allow you to access the balances and movements of the accounts for planning up to the row that is calculated.You can enter a formula that through the budgetTotal function, recovers the value of the sales account "SALES" of the previous month.
credit( budgetTotal("SALES", "MP") )
The budgetTotal function takes account numbers and periods as arguments. An abbreviation can be used instead of the period.
- MP stands for previous month.
- QP stands for previous quarter.
Revenues show in Credit, therefore the value returned by the function will be negative and will not be accepted as an amount in the double entry accounting.
Therefore use the credit () function, which uses the negative value and turn it into a positive value.
Variables for monthly sales
Sales may vary for each month. In this case it is useful to use separate registrations for each month with the variable name.
sales_01 = 1000
cost_01 = sales_01 * costOfGoodsSold
sales_01 = 1100
Deferred payments
If you want a very precise liquidity plan, it is useful to separate the sales, which are paid immediately and those that are deferred.
One approach may be to record all sales as if they were paid cash, assigning the value of the monthly variable to the amount.
sales_01 = 1000
A registration is then entered, which reverses the sales that are deferred, calculating the amount with the formula.
sales_01 * latePaymentPercentage
A payment registration with the same formula will then be inserted for the following month.
Selling costs
There are costs that can be related to sales (cost of goods) or to other costs (social charges, in relation to wages).
Cost calculation with variables
If the sales are defined with variables, the sales costs can also be indicated as a percentage of the sales.
- You can define variable S for sales and variable C for the percentage of the cost.
Sales=1000
Cost=60 - The formula for the calculation will be:
Sales*Cost/100
You can also use the same approach to calculate social security charges.
This formula can possibly be entered in a repetitive row.
Sales cost calculation with budget functions
When the costs are related to sales, the budget formula can also be used.
credit( budgetTotal("SALES", "MC") )*60/100
When the costs related to sales, "MC" stands for the current month.
This formula will return the sales value of the current month, turn them into a positive and multiply them by 60 and divide by 100.
The date must be beyond the sales registration dates, obviously.
It may be used it in a repeat row, inserting the month end date. Therefore, the costs of the sale will automatically be calculated based on the sales entered with the transaction.
The formula can be combined with variables.
- At the beginning of the year define the percentage of costs.
Cost=60 - Therefore, the formula C is used.
credit( budgetTotal("SALES", "MC") )*Cost/100
When you change the contribution percentage or any sale, the schedule will be updated automatically.
Sales commission calculation at the end of the year
At the end of the year, you calculate the commissions of 5% on the total net sales with this formula:
credit( budgetTotal("SALES", "YC") )*5/100
The bugetTotal function returns the movement of the sales account for the period "YC", current year. With the credit () function, the amount is turned into a positive value and then multiplied by 5 and divided by 100.
If you make forecasts over several years, remember to insert the repetition "Y" in the row, so that the same formula will be also calculated for the previous year. As indicated above instead of entering the 5 directly in the formula, you can assign it with a variable.
- Commission=5
- credit( budgetTotal("SALES", "YC") )*Commission/100
If the percentage changes from one year to the next, it is sufficient enter a transaction with the following year date that resets the variable for commissions.
Inflation with variables
If you want to forecast over several years, you can also take inflation into account.
- At the beginning of the planning, assign a base variable for prices and inflation (2%).
Base=1;Inflation=2 - When you use the Sales variable, you multiply it by the inflation rate
Sales=Sales*Base - At the beginning of the following year, with annual repetition, you increase the price base
Base=Base+Base*Inflation/100
Depreciation calculation
Thanks to the formulas, the calculation of depreciation can be automated.
If you change the value of your investments in planning, depreciation will be automatically recalculated. Make sure that the date of the depreciation calculation line has a date superior to that of the investments. Date is generally 31st December .
Depreciation calculation on book value
To calculate the depreciation of the "EQUIPMENT" account, insert a line at the end of the year with the following formula and the debit and credit accounts appropriately set up to register the depreciation.
budgetBalance("EQUIPMENT")*20/100
The budgetBalance function returns the balance to that date. The amortization of 20% is then calculated on this.
Use the debit function, in case you think the asset account can go into credit.
debit(budgetBalance("EQUIPMENT"))*20/100
Calculation of depreciation on the initial value
To calculate the initial value of the investments, it is necessary to use variables to remember the value of the initial investment.
Equipment=10000
If the depreciation is spread over 5 years, the formula will be inserted in the year-end depreciation line
Equipment=10000/5
The annual repetition "Y" and the end date, which corresponds to the date of the last installment of the amortization, will be inserted in the row to prevent the amortization from running on indefinitely.
For each investment you will have to create a variable and a specific row of depreciation. Numbers can also be entered in variable names.
Equipment1=10000
Equipment2=5000
Interest calculation
The budgetInterest( account, interest, startDate, endDate) function allows you to automatically calculate interest based on the actual use of an account.
The parameters are:
- Account
Whose movements are used to calculate interest, in case it will be the bank account or the loan. - Interest
The interest rate in percentage.
If the value is positive, interest on the debit balances is calculated.
If the value is negative, interest on the credit balances is calculated.. - Initial date, which may also be an acronym.
- End date, which may also be an acronym.
- The returned value is the interest calculated for 365/365 days.
Interest expense on the bank account
To calculate the interest expense of 5%, insert a line with the end date of the quarter and the repetition "3ME", which contains the formula
budgetInterest( "Bank", -5, "QC")
The interest rate is negative, because "QC" means current quarter. The debit and credit accounts must be the usual ones for recording interest expense. If the interest decreases the bank account balance will also be used in the registration. However, another account can be used if it is paid with another account.
It is important that the "3ME" repeat is used so that the date used will always be the last of the quarter.
To calculate the interest of the month use the abbreviation "MC"
budgetInterest( "Bank", -5, "MC")
Interest on the bank account
For interest income of 2%, use positive interest instead.
budgetInterest( "Bank", 2, "QC")
Interest on fixed-term loan accounts
For fixed-term loans, interest will be calculated and recorded on the specified date.
- Create an separate account for each loan.
Use the budgetInterest function indicating exactly the start and end dates .If the date is indicated as text, the notation "yyyy-mm-dd" should be used, then "2022-12-31" - Use variables.
As indicated for depreciation, the loan amount can be assigned to a variable. The interest calculation will be done with a Javascript calculation formula,- Define the loan variable
Loan=1000 - 5% interest calculation, for 120 days.
Loan*5/100*120/365.
- Define the loan variable
Profit tax calculation
Profit is the total of the group's profit for the specified period.
To calculate a 10% profit tax, use the following formula.
credit(budgetTotal("Gr=Result","MC"))*10/100
- Use the the budgetTotal function parameter in the "Gr = Result" group, which indicates that instead of an account it has to calculate the movements for the group.
- MC, current month, is indicated as the period.
- The budgetTotal function will return a positive value if there is a loss and negative (credit) if there is a profit.
- the credit function takes only negative values into account, therefore if there is a loss the tax will be zero.
Payments with deferred or different deadlines
For deferred payments or with different deadlines, you can proceed in two ways:
- Use variables to which payment amounts are to be assigned.
Use the variable in question when recording the payment. - Create customer or supplier accounts for different credit deadlines.
Other cases
Please tell us about your other requirements, so we can add more examples.
Planning Settings
Adding a Budget table
Proceed by Adding a Budget table if the accounting file does not yet contain it.
Planning only
Accounting and planning are kept in the same file. However, it is however possible to manage the Budget only, by simply not inserting rows in the Transactions table.
- For a Startup
- For the preparation of the financial plans for a new firm, with not yet started financial plans.
- Initially, if you are working at the level of ideas it might be useful to select a model with few accounts, without VAT.
- If you plan to keep the accounting as well, it will be useful to start out with a Chart of Accounts already set up for a real company.
- For an existing firm
- Accounting is kept with another program.
- The Chart of Accounts will be modeled on that used for accounting.
- To compare with the actual accounting data:
- You can export the budget data and import it into the accounting program.
- You can export the accounting data and import it into the budget file.
- You can create Excel spreadsheets and report planning and accounting data.
Set up a planning
The procedure is the same, whether you manage one accounting on a standalone basis, only one budget or both together:
- Create an accounting file
- Set up the file properties
- Set up the Chart of Accounts
- Enter opening balances (if available)
- Enter the forecast values in the Budget table.
The Transaction table, however, remains preset, if you do not wish to display it, use the Data Menu -> Tables setup ... and tick the Transactions table as not visible.
Planning period
It is not necessary to define the planning period. You can set up the planning for one year and and also get forecasts for the following years.
Annual planning
As a rule, the planning is prepared for the accounting period defined in the file properties, which generally is identical to the calendar year.
- The opening balance at the beginning of the period is entered in the Opening column of the Accounts table.
- The budget data for the current year is entered in the Transactions table.
When requesting Reports, the program uses the accounting period, if a different period is not specified.
When you want to plan for the following year, you create a file for the new year. The program shows the budget postings, which can then be modified (see Create new year ... in Account2 menu).
Multi-year planning
With Banana Accounting you can have planning over several years available. The planning period is free, at the moment you request the report and set the Forecast period.
To make a planning over several years, generally proceed by setting the planning for the first year, then extending it for the following years.
Technically, therefore, proceed as if you were making an annual plan, extending it for the following years:
- In the file properties, the date of the first year (which is generally the calendar year,) is indicated as the start and end date.
- The opening balances are entered in the Chart of Accounts.
- The movements of the planning are inserted in the Budget table
- The operations that are specific to the first year only, when they are indicated without repetition.
- Indicate the repetition code for all other operations, which are presumed to repeat also in subsequent years.
- Operations that take place only once a year are indicated by the annual "Y" repetition code. For example, the calculation of depreciation, that is done at the end of the year.
- Specific operations for subsequent years are indicated with the respective date on which they occur.
- For repetitive operations that are limited to a single year or to a specific period (fixed-term leasing transactions) the End date will be indicated. After that date, no repetition will be made.
- Formulas may be used to make the amount to repeat automatic in the row .
- The calculation of depreciation can be based on the balance of the fixed assets account.
- Interest can be calculated directly on the movement in the bank account.
- A progression of sales can be specified.
- Purchases can be defined as a percentage of the cost.
- To obtain the planning (Enhanced Balance Sheet/with groups Report, Accounting reports, indicate the start and end date of the required budget.
Changeover to the new year
The Banana Accounting function for Creating a new year ... also carries forward the budgeting records.
- At the level of each row you have the possibility to indicate whether the operation should be carried over or not, and whether the original data should be kept or replaced by that of the new year.
- Creating the budget for the new year is therefore very simple, because it is only a question of changing the items of expenditure and income that are expected to change.
Reports financial forecasting
Provisional Balance Sheet
The Balance Sheet forecast displays the Balance Sheet for a future period. It is an important tool for tracking the management of your company and allows you to verify what the company's capital structure will be like, the state of assets, of liabilities and the equity.
With Banana Accounting, thanks to the forecasting with the double entry method, you have complete forecast budgets and that you can arrange in different ways. The program also calculates forecasts over several years.
You can access a very precise vision of what the future balance sheet will look like.
The structure of the budget is the same as that used in the accounting file. When printing, you can indicate which values to display, those of the final balance, the estimate or both of those.
The forecast values are calculated taking into account the opening balances and forecast movements indicated in the Budget table. When you change a budget entry, the forecasts are instantly updated. You can simulate and test, relocate a payment, add an investment, modify sales and see how the budget changes over time.
Budget forecast values can be displayed in several ways.
Detailed forecast
The financial forecast, based on the double entry method, allows to obtain the forecasts of the balance sheet values, using the same accounts and groups as those of the accounting file. The same structure of the items that make up the financial statements is used for forecasting. Values and reports are available automatically to display in detail, day by day, how liquidity evolves, the situation of customers.
The Banana Accounting forecast presents the values for assessing the financial, equity and economic situation. The structure is customizable, it can be presented in a simple way, including the main groups and the accounts that are part of it, or in a more complex way, by inserting subgroups, for a more detailed view.
ASSETS
Current assets
- Liquidity
- Credits
- Inventory
Fixed assets
- Movable assets
- Real estate
LIABILITIES
Third party capital
- Short term debt
- Long term debt
Own capital
- Reserves
- Profit/Loss previous years
- Profit/Loss current year
Account table
In the Budget column of the Accounts table you access forecast values for all accounts and balance groups available. In a glance you have an instant overview of the budget. The values refer to the accounting period and the variations are calculated automatically with respect to the current balance.
If you need more details, you can add accounts or groups.

Enhanced Balance sheet with groups
Through Enhanced Balance Sheet with groups command, you can view the Provisional Balance Sheet, choosing the presentation mode you need.
- Indicate the values of the Budget in the columns section.
You can display the current (accounting) values, the estimate values or both. - Set up the Period.
If a period that exceeds the accounting period, is indicated, the program will automatically switch to budgeting over several years. - Indicate the subdivision by period required.
- In the Rows section, you can exclude accounts and thus have a view of groups only.
- If you think you're use this print setting again, create a Composition.
Using the different options you can customize your prints. Below are some examples.
Forecast balance sheet at the end of the current year
This print has been set up with the figures for the current year only.

Forecast budget and comparison with the current year
The final (current) figures are compared with those of the estimate.
You can also view the variation as an amount and a percentage.
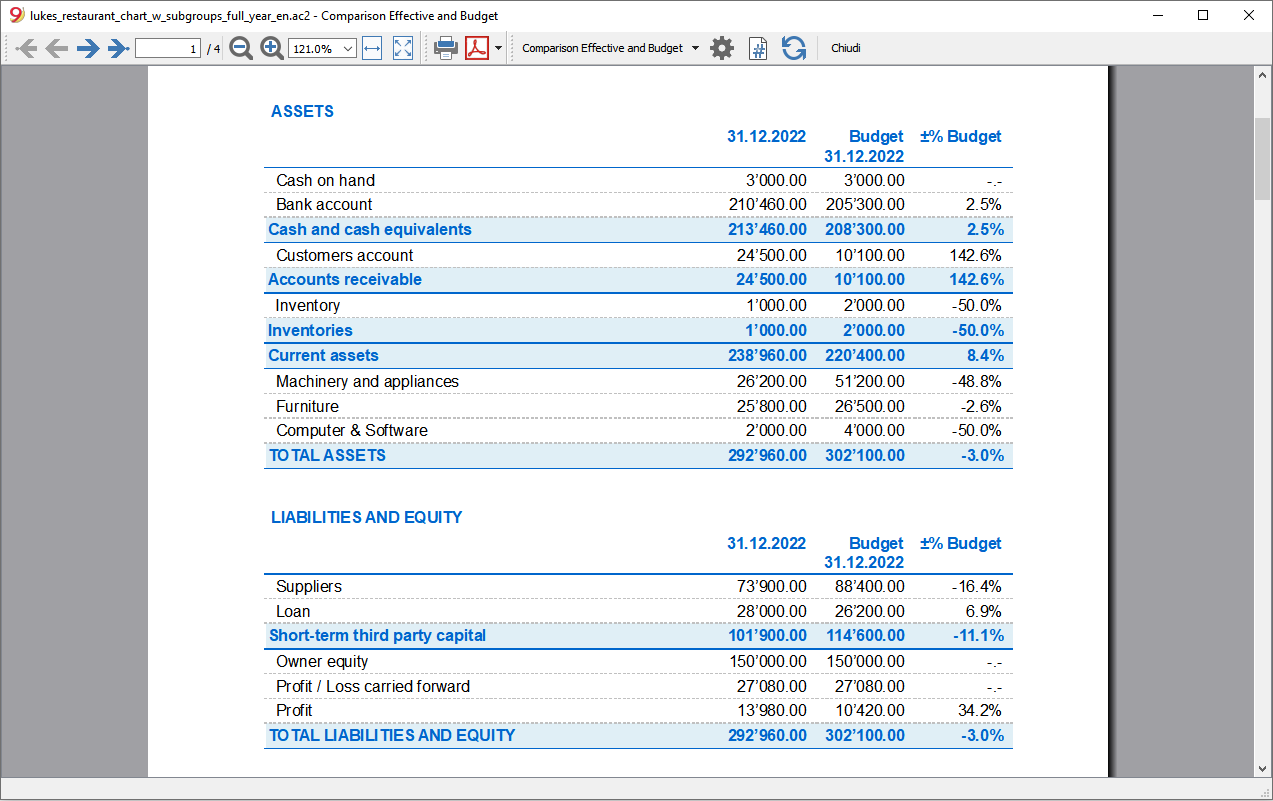
Quarterly budget
In the Subdivision section set to quarterly and the schedule shows the budget at the end of each quarter.
The evolution of the budget forecast during the year can be tracked.

Quarterly budget with comparison
This printout is set up to print both the estimate and the final balance. We therefore have the expected and current situation at the end of each quarter.

Three-year budget
This printout is set up to print the three-year budget forecast.
In the Period section set the reference period to three years and in the Subdivision section set to one year. In the File properties (File menu) there must be 3 years as the start and end period (e.g. start 01.01.2022 - end 31.12.2024).

Accounting Report
The Accounting Report is similar to the one for Enhanced balance sheet with groups, with the difference that the display takes place in the Accounts table in columns.
You can therefore use it to get an instant view of the evolution of liquidity accounts.

Provisional Profit and Loss account
The Income statement forecast presents the profits, costs and result for a future period. It is an important tool for tracking the management of the company which allows you to understand how the financial situation will evolve.
With Banana Accounting, thanks to the forecasts with the double entry method, you have complete forecast budgets and that you can organize in different ways. The program also calculates forecasts over several years.
You can have a very precise vision of the evolution of the economical situation.
The structure of the Income statement is the same as that used in accounting file. When printing, you can indicate which values to display, those of the final balance, or the budgeted balance or of both.
The forecast values are calculated taking into account the opening balances and forecast movements indicated in the Budget table. When you change a budget entry, the forecasts are instantly updated. You can simulate and test, relocate a payment, add an investment, modify sales and see how the budget changes over time.
Income statement values can be displayed in several ways.
Use of quantities and formulas
The quantity and price column of the Budget table allow you to prepare more realistic forecasts, using the same methodology as spreadsheets. This allows for faster simulations. It is sufficient that you change the price and you access the new forecasts of the income statement automatically and also those of the Balance Sheet and Liquidity.
The formulas allow you to automate cost calculation, so that for example, when you change sales the purchase costs change in percentage. In this way you can use precise income statement forecasts that update automatically. Formulas are particularly useful when making forecasts over multiple years.
Detailed forecasts
The Income statement forecast, based on the double entry method, allows you to obtain the forecasts of the costs and revenues, using the same accounts and groups as those of the accounting file. The same structure of the items, that make up the income statements, is used for forecasting. Values and reports are available automatically to display in detail, day by day, how liquidity evolves and the situation of customers.
The structure of the Chart of Accounts, on which the forecast is also based, is customizable. This can be done by simply using the main groups and the accounts that are part of it, or more in a more complex way, by also inserting subgroups, for a more detailed view.
The structure of the Profit and Loss Account is gradually scaled and allows you to view the interim and final results for the year after paying the taxes.
INCOME STATEMENT
- Revenues.
- Cost of goods.
Gross operating result (total of Revenues and Costs).
- Staff costs
- General costs.
Operating result (total of the gross operating result, personnel costs and general costs).
- Financial costs.
Operating result before taxes and depreciation(Total of operating result and financial costs).
- Depreciation.
Operating result before taxes (Total of ordinary Result and Depreciation).
- Taxes
Profit and Loss before Taxes (total of the Result before taxes and Taxes and duties).
Accounts / Category Table
In the Budget column of the Accounts table, for double entry accounting, and of the Categories table for revenue and expenditure, the forecast values for all the accounts and groups of the Income statement are displayed. With a glance you have an instant view of the forecasted Income statement. The values refer to the accounting period and the variations are compared to the current balance.
If you require more details, you can add accounts or groups.

Enhanced Balance sheet with groups
Through Enhanced Balance Sheet with groups command, you can view the Provisional Balance Sheet, choosing the presentation mode you need.
- Indicate the values of the Budget in the columns section.
You can display the current (accounting) values, the estimate values or both. - Set up the Period.
If a period that exceeds the accounting period, is indicated, the program will automatically switch to budgeting over several years. - Indicate the subdivision by period required.
- In the Rows section, you can exclude accounts and thus have a view of groups only.
- If you think you're use this print setting again, create a Composition.
Using the different options you can customize your prints. Below are some examples.
Forecast balance sheet at the end of the current year
This print has been set up with the quote values for the current year only.

Forecast income statement and current year comparison
The final (current) values are compared with those of the forecast.

Quarterly forecast income statement
In the Subdivision section set quarterly and the program shows the forecast income statement for the various quarters.
The evolution of the budget forecast during the year will now be displayed.

Quarterly budget with comparison
This printout is set up to print both the estimate and the final balance. We therefore have the expected and current situation at the end of the quarters.

Three-year forecast for Profit and Loss account
If you insert the forecast movements with the repetition code, the program is able to prepare forecasts beyond the defined period.
To obtain forecasts over several years, the transactions are entered in the Budget table with repetition (Y).
The printout is set up to obtain the estimate of the income statement over three years.

Accounting Report
The Accounting Report is similar to the one for Enhanced balance sheet with groups, with the difference that the display takes place in the Accounts table in columns.
You can therefore use it to get an instant view of the evolution of liquidity accounts.

Liquidity Planning
Cash is King is the motto that indicates how important liquidity is. It is the main engine for carrying out business activities, meeting commitments and producing profits. To invest safely, it is essential to evaluate the ability to produce liquidity and its evolution over time a rational way.
The financial forecast of Banana Accounting is an important business management tool, which allows you to understand if there will be enough financial means to meet commitments and reduce your debt exposure to the maximum.
Liquidity projections are calculated on the basis of the initial balance and forecasts included in the Budget table. When a budget movement is changed, the forecasts are instantly updated. You run simulations, assign a payment, add an investment, modify sales and see how liquidity evolves.
Liquidity values can be displayed in several ways.
Accounts table
Set up accounts and liquidity groups in the Accounts table. In the Budget column you will also see the updated forecast balances for the accounting period. At a glance you will know what the liquidity situation will be at the end of the year.

Evolution graphs
When you open the Graphs window, positioning the cursor on an account or a group you will see the graph of the evolution of Liquidity.
If you click on the Current, Previous or Estimate caption, you can hide the graph.
Account card with estimate data
Using Account card command you have the possibility to see in detail, day by day, how liquidity evolves. You can see all the movements that have an impact on liquidity.

The Account card command allows you to specify if you want to see current or budgeted movements.
- Select budget movements.
- Set the period
If you indicate a period that exceed the accounting period, the program will automatically generate Forecasts over several years. - If you indicate a group, you will see the movements of all the accounts belonging to that group.
- When you are in the Budget table, you can access the account card with a click on the icon next to the account.
Enhanced Balance sheet with groups
Through Enhanced Balance Sheet with groups you may select to work with values subdivided by column per period. In this way you can see the evolution of liquidity by day, week, month, quarter, semester, year, etc.
- In Columns section indicate that you wish to view the Budget values.
- In Sections you can select the accounts or groups you want to include in the printout.
You may select to display the asset and depreciation accounts only. - Set up the Period.
If a period that exceeds the accounting period, is indicated, the program will automatically switch to budgeting over several years. - Indicate the subdivision by period required.
- If you think you're use this print setting again, create a Composition.

Accounting Report
The Accounting Report is similar to the one for Enhanced balance sheet with groups, with the difference that the display takes place in the Accounts table in columns.
You can therefore use it to get an instant view of the evolution of liquidity accounts.

Forecasting sales
Sales for a company are the main source of income and liquidity. Unlike costs that are more easily planned, sales are more difficult to budget. As a rule of thumb, you may base yourself on the figure of the sales of the previous year for the same period or, on the possibility important events that are in the pipeline and could lead to an increase in sales or even to the acquisition of new customers.
Based on this concept, Banana accounting, with the forecast based on double-entry accounting, allows you to simulate and project different scenarios over time. Just change the budgeted amounts for sales and the program automatically updates the forecasts and displays detailed reports for the current year or for future years.
The sales projections are calculated on the basis of the forecasts included in the Budget table and can be displayed in different ways.
Accounts table
Set up accounts and sales groups in the Accounts table. In the Budget column you will also have the updated forecast balances for the accounting period. You can check what the evolution of sales will be during the year, at a glance

Evolution chart for sales
If you display the Graphs window, position the cursor on an account or a group and you will see the graph of the evolution of the sales.
If you click on the Current, Previous or Budget caption, you can hide the graph.
Account card with Budget data
With the Account card you are offered the possibility to display in detail and day by day, how sales evolve. You can examine all the movements that impact sales.

The Account card command allows you to specify if you want to display current or budgeted movements.
- Select thebudget movements.
- Set the period.
If you indicate a period that extends beyond the accounting period, the program will automatically generate Forecasts over several years. - If you indicate a group, you will see the movements of all the accounts belonging to that group.
- When you are in the Budget table, you can access the account card with a click on the icon next to the account.
Enhanced Balance sheet with groups
Through Enhanced Balance Sheet with groups you may select to work with values subdivided by column per period. In this way you can see the evolution of liquidity by day, week, month, quarter, semester, year, etc.
- In Columns section indicate that you wish to view the Budget values.
- In Sections you can select the accounts or groups you want to include in the printout.
You may select to display the asset and depreciation accounts only. - Set up the Period.
If a period that exceeds the accounting period, is indicated, the program will automatically switch to budgeting over several years. - Indicate the subdivision by period required.
- If you think you're use this print setting again, create a Composition.

Financial forecasting for customers
Customers forecasting completes financial planning with customer data. For example, a company can forecast sales by indicating accounts for the most important customers.
Forecasting with the double entry method also allows you to indicate accounts for individual clients. Depending on the requirement, customer management can be done with balance sheet accounts, profit and loss accounts or with cost and profit centers.
When changing a budget movement, the forecasts for each customer are also updated individually.
Accounts table
Set up accounts for customers in the Accounts table. In the Estimate column you will also have the updated forecast balances for the accounting period. At a glance, you can view what the forecast for the individual customer will be.

Evolution chart
If you display the Graphs window, positioning the cursor on an account or a group you will see the graph for the evolution of the customers.
If you click on the Current, Previous or Estimate caption, you can hide the graph.
Account card with estimate data
With the Account card command you have the possibility to see in detail all the movements for each customer.

- Select budget movements.
- Indicates the customer's account.
- Set up the period.
If you indicate a period that extends beyond the accounting period, the program will automatically generate Forecasts over several years. - When indicating a group, you will see the movements of all the accounts belonging to that group.
- When in the Budget table, you can access the customer's card with a click on the small icon next to the account number.
Enhanced Balance sheet with groups
Through Enhanced Balance Sheet with groups you may select to work with values subdivided by column per period. In this way you can see the evolution of liquidity by day, week, month, quarter, semester, year, etc.
- In Columns section indicate that you wish to view the Budget values.
- In Sections you can select the accounts or groups you want to include in the printout.
You may select to display the asset and depreciation accounts only. - Set up the Period.
If a period that exceeds the accounting period, is indicated, the program will automatically switch to budgeting over several years. - Indicate the subdivision by period required.
- If you think you're use this print setting again, create a Composition.
Accounting Report
The Accounting Report is similar to the one for Enhanced balance sheet with groups, with the difference that the display takes place in the Accounts table in columns.
You can therefore use it to get an instant view of the evolution of liquidity accounts.

Financial forecasting for suppliers
Supplier forecasting completes financial planning with supplier data. For exa, a company can plan purchases by indicating purchases by indicating accounts for the most important suppliers. It will thus be able to analyze and optimize the relationship with the various suppliers, perhaps by requesting payment extensions.
Forecasting with the double entry method also allows you to indicate accounts for individual suppliers. Depending on the need, suppliers management can be done with balance sheet accounts, profit and accounts or with cost and profit centers.
When changing a budget movement, the forecasts for each individual supplier are also updated.
Accounts table
Set up accounts for suppliers in the Accounts table. In the Estimate column you will also have the updated forecast balances for the accounting period. At a glance you can know what the forecast for the individual supplier will be.

Evolution chart
If you view the Graphs window, positioning the cursor on an account or a group you will see the graph for the evolution of the suppliers.
If you click on the Current, Previous or Estimate legend, you can hide the graph.
Account card with estimate data
With the Account card command you have the possibility to see in detail all the movements for each supplier.

- Select budget movements.
- Indicates the supplier’s account.
- Set up the period.
If you indicate a period that extends beyond the accounting period, the program will automatically generate Forecasts over several years. - When indicating a group, you will see the movements of all the accounts belonging to that group.
- When in the Budget table, you can access the customer's card with a click on the small icon next to the account number.
Enhanced Balance sheet with groups
Through Enhanced Balance Sheet with groups you may select to work with values subdivided by column per period. In this way you can see the evolution of liquidity by day, week, month, quarter, semester, year, etc.
- In Columns section indicate that you wish to view the Budget values.
- In Sections you can select the accounts or groups you want to include in the printout.
You may select to display the asset and depreciation accounts only. - Set up the Period.
If a period that exceeds the accounting period, is indicated, the program will automatically switch to budgeting over several years. - Indicate the subdivision by period required.
- If you think you're use this print setting again, create a Composition.
Accounting Report
The Accounting Report is similar to the one for Enhanced balance sheet with groups, with the difference that the display takes place in the Accounts table in columns.
You can therefore use it to get an instant view of the evolution of liquidity accounts.

Investments Planning
The investment plan presents the expected evolution of the equipment, stocks, movable or immovable values that are necessary for the company.
With Banana Accounting, thanks to the forecasting with the double-entry method, you can track what the evolution of assets will be over time. You generate comprehensive forecasts, which you can organize in different ways. The program also calculates forecasts over several years.
The structure of the accounts is identical to the one used for accounting. When printing, you can indicate whether to select which values to display, the final ones only, the forecasted ones or both together.
You also have the Income statement forecasts, so you can display the evolution of amortization and interest. When a budget movement is changed, the forecasts are immediately updated. You can run simulations, assign a payment, add an investment, change sales and see how asset accounts evolve.
For the Investment Plan, you have the same options as in the Liquidity Planing and the Provisional Profit and Loss Account.
Using formulas
The formulas allow you to automate calculation of depreciation and interest. When you increase an investment, the Income statement will also be instantly be updated. Formulas are particularly useful when making forecasts over multiple years.
Chart of Accounts
In the Budget column of the Chart of Accounts the forecast values for all accounts and balance groups are displayed, and therefore, for all those relating to investments equally. With a glance, you have an instant view of the values referring to the accounting period.

If you require more investment details, you may add accounts or groups.
Evolution graphs
If you view the Graphs window, positioning the cursor on an account or a group you will have the graph of the evolution of the investments.
If you click on the Current, Previous or Estimate caption, you can hide the graph.
Account card with estimate data
Using the Account card command, will offer you the possibility to see in detail, day by day, the evolution for each asset and the depreciation accounts. You can check all the movements that have an impact on investments.
The Account card command allows you to specify if you want to see current or budgeted movements.

- Select budget movements.
- Set the period
If you indicate a period that exceeds the accounting period, the program will automatically generate Forecasts over several years. - If you indicate a group, you will see the movements of all the accounts belonging to that group.
- When you are in the Budget table, you can access the account card with a click on the small icon next to the account.
Enhanced Balance sheet with groups
Through Enhanced Balance Sheet with groups you may select to work with values subdivided by column per period. In this way you can see the evolution of liquidity by day, week, month, quarter, semester, year, etc.
- In Columns section indicate that you wish to view the Budget values.
- In Sections you can select the accounts or groups you want to include in the printout.
You may select to display the asset and depreciation accounts only. - Set up the Period.
If a period that exceeds the accounting period, is indicated, the program will automatically switch to budgeting over several years. - Indicate the subdivision by period required.
- If you think you're use this print setting again, create a Composition.

Accounting Report
The Accounting Report is similar to the one for Enhanced balance sheet with groups, with the difference that the display takes place in the Accounts table in columns.
You can therefore use it to get an instant view of the evolution of liquidity accounts.

Corporate financing plan
The corporate financing plan presents the expected evolution of the accounts relative to the origin of third party and own capital.
With Banana Accounting, thanks to the forecasting with the double-entry method, you can track what the evolution of assets will be over time. You generate comprehensive forecasts, which you can organize in different ways. The program also calculates forecasts over several years.
The structure of the accounts is identical to the one used for accounting. When printing, you can indicate whether to select which values to display, the final ones only, the forecasted ones or both together.
Income statement forecasts are also available, so you can display the evolution of depreciation and interest. When a budget movement is changed, the forecasts are immediately updated. You can run simulations, assign a payment, add an investment, change sales and see how asset accounts evolve.
For the Investment Plan, you have the same options as for the Liquidity Planing and the Provisional Profit and Loss Account.
Using formulas
The formulas allow you to automate calculation of depreciation and interest. When you increase an investment, the income statement will also be instantly be updated. Formulas are particularly useful when making forecasts over multiple years.
Chart of Accounts
In the Budget column of the Chart of Accounts the forecast values for all accounts and balance groups are displayed, and therefore, also for all those relating to investments. With a glance you get an instant view of the values referring to the accounting period.

If you require more investment details, you may add accounts or groups.
Evolution graphs
If you view the Graphs window, positioning the cursor on an account or a group you will see the graph of the evolution of the corporate finances
If you click on the Current, Previous or Estimate caption, you can hide the graph.
Account card with estimate data
Using Account card command you have the opportunity to see in detail, day by day, The evolution for each asset and on the depreciation accounts. You can see all the movements that have an impact on investments.
The Account card command allows you to specify if you want to see current or budgeted movements.

- Select budget movements.
- Set the period
If you indicate a period that exceed the accounting period, the program will automatically generate Forecasts over several years. - If you indicate a group, you will see the movements of all the accounts belonging to that group.
- When you are in the Budget table, you can access the account card with a click on the icon next to the account.
Enhanced Balance sheet with groups
Through Enhanced Balance Sheet with groups you may select to work with values subdivided by column per period. In this way you can see the evolution of liquidity by day, week, month, quarter, semester, year, etc.
- In Columns section indicate that you wish to view the Budget values.
- In Sections you can select the accounts or groups you want to include in the printout.
You may select to display the asset and depreciation accounts only. - Set up the Period.
If a period that exceeds the accounting period, is indicated, the program will automatically switch to budgeting over several years. - Indicate the subdivision by period required.
- If you think you're use this print setting again, create a Composition.
Accounting Report
The Accounting Report is similar to the one for Enhanced balance sheet with groups, with the difference that the display takes place in the Accounts table in columns.
You can therefore use it to get an instant view of the evolution of liquidity accounts.

Project planning with profit and cost centres
Financial planning of projects allows you to take control over the income and expenses of a project. It is used to evaluate investments and returns on a project and to track its implementation.
Budgeting with the double-entry method allows you to indicate profit and cost centres as well. You only need to set up cost centers for the different projects, and in parallel to the balance and income statement forecasts, you will have the forecasts available for each individual project.
The projections are calculated on the basis of the initial balance and the forecasts entered in the Budget table. When a line is changed the budget, forecasts are instantly updated. You can produce simulations, reassign a payment, add an investment, modify sales and spot how the budget changes.
Values of liquidity can be displayed in several ways.
Chart of Accounts
Profit and Cost centres are set up in the Chart of Accounts. In the Estimate column you will also have the updated forecast balances for the accounting period. At a glance you can know what the liquidity situation will be at the end of the year.

Evolution chart
In the Graphs view window, position the cursor on an account or a group and a graph of the evolution of the projects will be displayed.
Clicking on the Current, Previous or Estimate legend, you can hide the graph.
Account card with budget data
With the Account card command you have the possibility to display all the movements for the single project in detail.

- Select budget movements.
- Indicate the cost or profit center.
- Set the period.
If you indicate a period that extends beyond the accounting period, the program will automatically switch to Forecasts over several years. - When you indicate a group, you will see the movements of all the accounts belonging to that group.
- When in the Budget table, you can access the cost center tab by clicking on the small icon next to the account number.
Enhanced Balance sheet with groups
With the Enhanced Balance sheet with groups you choose to divide the values into separate columns for each segment. Thus, you dispose of a view of the evolution of individual projects by day, week, month, trimester, semester, year etc..
- Indicate that you wish to display the Budget values in the Columns section.
- In Sections you may choose to view the the cost and profit centres only.
- Set up the Period.
If you indicate a period that extends beyond the accounting period, the program will automatically switch to Forecasts over several years. - Indicate the required subdivision by segments.
- If you think of continuing to use this print setting, create a composition.

Accounting report
The Accounting report is similar to the Enhanced balance sheet with groups, with the difference, that the display takes place in columns.
It can therefore be used to display an instant view of the evolution of the segments.

Planning with segments per sector and branch
The financial planning by sectors allows you to run budget and income statement forecasts for each sector or branch of the company. It therefore allows you to evaluate the various sectors of the company and understand what contribution each of them brings to the overall activity.
Budgeting with the double-entry method permits you to designate segments as well. When you set the segments for the different sectors, use them when you enter the budget movements and the budget and income statement forecasts will be made available, divided by the different sectors.
The projections are calculated on the basis of the initial balance and the forecasts entered in the Budget table. When a line in the budget is changed , forecasts are instantly updated. You can produce simulations, reassign a payment, add an investment, modify sales and spot how the budget changes.
Values of liquidity can be displayed in several ways.
Chart of Accounts
Segments are set up in the Chart of Accounts. When indicating the segments for the Balance Sheet and Income statement accounts, the balance of the segment will always result as zero in the accounts.

Account card with budget data
With the Account/Category cards command you have the possibility to examine all the movements for each segment in detail.
- Select budget movements
- Indicate the required segment.
- Set the period.
If you indicate a period that extends beyond the accounting period, the program will automatically switch to Forecasts over several years. - If you indicate a group, you will see the movements of all the segments belonging to that group.
- When you are logged in the Budget table, you can access the cost center tab with a click on the small icon next to the account number.

Enhanced Balance sheet with groups
With the Enhanced Balance sheet with groups you choose to divide the values into separate columns for each segment. Thus, you dispose of the Balance Sheet and Income statement for each sector.
- Indicate that you wish to display the Budget values in the Columns section.
- In Sections you may choose to view the balance sheet or income statement only.
- Set up the Period.
If you indicate a period that extends beyond the accounting period, the program will automatically switch to Forecasts over several years. - Indicate the required subdivision by segments.
- If you think of continuing to use this print setting, create a composition.

Accounting report
The Accounting report is similar to the Enhanced balance sheet with groups, with the difference that, the display takes place in columns.
It can therefore be used to display an instant view of the evolution of the segments.

New year for financial forecasting
The function to Create a New Year also takes up the budget movements.
For each row in the table Budget, in the For New Year column, you have the possibility to indicate:
- Whether the operation is to be copied over or not,
- If the date is to be kept or replaced with the date of the new year.
Creating the budget for the new year is therefore simple, because you have to modify or add the expense and income items that are expected to change.
Budget annuel simple (Tableau Comptes)
Si vous avez besoin d'un budget simple des dépenses et des recettes annuels, il faut utiliser la colonne Budget qui se trouve dans le tableau Comptes ou Catégories, vue Budget; il n'est pas nécessaire d'ajouter le tableau Budget.
En règle générale, seul le budget pour les recettes et les dépenses est indiqué (ou dans la comptabilité en partie double, les charges et les produits).
Les valeurs du budget doivent être saisies pour chaque compte ; le programme calcule automatiquement les totaux, ainsi que le bénéfice ou la perte.
- Pour la comptabilité en partie double, les produits (Crédit) doivent être inscrits comme négatifs dans le tableau Comptes. Les charges (Débit) en positif.
- Pour la comptabilité dépenses/recettes, dans le tableau Catégories, les recettes doivent être présentées en positif et les dépenses en négatif.

Colonne Différence Budget
Dans la colonne Différence Budget, le programme calcule la différence entre le solde et la valeur indiquée dans la colonne Budget.
Impressions par période
Lors de l'impression par mois ou par trimestre, le programme divise la valeur indiquée dans la colonne Budget en portions mensuelles.
Pour la subdivision, le programme procède comme suit :
- Il calcule le nombre de mois sur la base des dates de début et de fin indiquées dans les propriétés de la comptabilité du menu Fichier→ Propriétés fichier (données de base).
- Il divise le montant du budget par le nombre de mois calculé.
- Toute différence d'arrondi est ajoutée au dernier mois.
Si, par exemple, vous avez saisi un montant de 10.000, celui-ci sera divisé en 11 mensualités de 833,33 et une mensualité de 833,37.
Si vous avez choisi de visualiser par trimestre, la valeur du trimestre sera la somme des mois individuels et non la valeur de l'année divisée par les trimestres.
Si vous souhaitez une planification différente par mois ou par trimestre, vous devez utiliser la planification avec le tableau Budget.
Fichier avec Tableau Budget
Si vous avez un fichier avec le tableau Budget déjà configuré et que vous souhaitez réaliser un simple budget dans le tableau Comptes ou Catégories, vous devez supprimer le tableau Budget :
- menu Outils → Ajouter de nouvelles fonctions → Supprimer tableau Budget.
Une fois que le tableau Budget a été supprimé, dans le tableau Comptes et Catégories, vue Budget, la colonne Budget est activée et vous pouvez saisir des valeurs.