Budget, Forecasting and Financial planning
All accounting software includes powerful and innovative Financial Planning tools based on the double entry method. You can easily display Balance Sheets, forecast Income statements, financial, liquidity and investment plans.
A vision of the future
When using the double entry accounting method, financial forecasts allow you to have a comprehensive vision of the future of the company. You can imagine what the situation will be before things happen, and you are offered the opportunity to take action in time. If you notice that the costs will be too high, you can examine measures to lower them. If you're made aware of a shortage of liquidity, you will have time to take steps to avoid it.
By using financial forecasts, you will add value to your management.
Financial forecasts within reach of everyone
The planning system based on the double-entry method is incredibly powerful and within everyone's reach.
- Planning is fully integrated into accounting.
- The identical Chart of Accounts as the one in your accounting is being used.
No need to set up a new file, just add the budget movements. - Forecasts are carried out with budget registrations.
The proven accounting method of double-entry accounting is used. Costs and revenues can be specified in detail. - Income statement and Balance Sheet forecasts are available.
You can see how sales, costs, profits, liquidity and the evolution of capital will evolve. - You can check the evolution of an account or a group with all the individual budget movements.
- The program prepares forecasts by month, quarter or year.
- Forecasts can be set up with quantities and calculation formulas.
When the forecast is changed, for example when an investment is increased, the year-end depreciation is automatically recalculated. - The financial plan prepared for one year can also be projected over several years.
- All accounting reports are available with the values of the past, present and future.
Financial forecasts and a simple budget in one column
The planning function, with financial projections of costs, revenues and liquidity, is integrated and available in all accounting applications.
There are two operating modes:
- Complete financial planning in the Budget table
The Budget table is added to the accounting file, which allows you to enter the forecast movements, which then serve to generate complete financial forecasts.
The Budget column of the Accounts table is automatically updated by the program on the basis of the transactions entered in the Budget table. - Annual budget in the Accounts table
A very simple and traditional method that involves entering the annual estimates in the Budget column of the Accounts or Categories table.
Then on the basis of the final balance, the program indicates the variation in the Difference Budget column, Accounts or Categories table.
See: Simple annual budget.
Below we focus on the method that uses the Budget table.
Instant display of the budget values
Financial planning, based on the double-entry method, uses the same Chart of Accounts as the accounting.
In the Accounts and Categories table (revenue and expenditure accounting) not only the current balances are displayed but also the budget balances.
You can freely set up the structure of the Balance Sheet and Income statement by adding accounts and groups.
You can also use cost and profit centers, segments, as well as accounts for customers and suppliers.
![]()
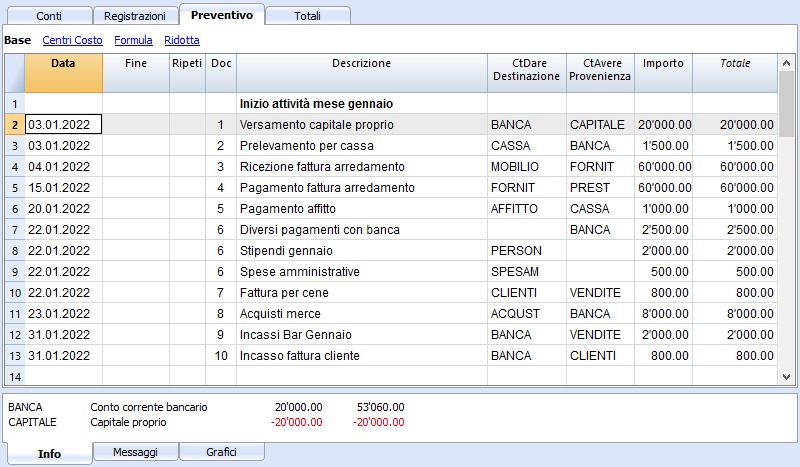
The Budget table
The planning is prepared by inserting transactions in the Budget table. This is like entering accounting records, but they concern the future.
The rent and other recurring transactions are indicated only once, setting the repeat option and any end date.
The sum for the year is indicated in the Total column.
You may add as many lines as you need, for the current year or for the following ones, carry out changes and modifications at any time.
A clear and comprehensive vision of the future of your business
Banana Accounting provides you with all the necessary reports to have a comprehensive view of your financial future, the same that are used for your accounting, all integrated and balanced, without differences, just like for accounting. All is automatic, you don't need to waste time setting up tables in Excel, inserting and checking formulas, setting up rows and columns.
- Liquidity plan.
You can see how liquidity will evolve in the chosen planning period, know in advance if you will have the means to cope with the different commitments and select whether to require a synthetic, by group or detailed view, with each item listed. - Forecast Income statement.
You can see what the revenues and costs and the expected result will be, select a summary view with the totals per group or even detailed with the values of the individual elements. The layout of the Income statement can be freely set and changed according to requirements. The program will do the totals automatically, without you having to enter formulas. - Forecast budget.
For each account and group of Assets and Liabilities you will see the evolution over time. - Investment plan.
For each account or group of Assets you can see the evolution over time in detail. - Detailed account cards.
You can analyze each item in detail, thanks to the account card, examine how the evolution of the bank account or liquidity is. - Graphs with evolution over time.
You can instantly see the future evolution of each item. With a single glance, you can check how sales will evolve or understand if there will be a liquidity crisis. - Cost and profit centers and segments.
You can also use cost centers, profit centers and segments when forecasting.
You can get detailed forecasts for individual projects, customers or geographical areas. - Projections over several years.
You can have the Balance Sheet and Income statement for one, two, five or even ten years.
The program automatically projects the data of the year for subsequent periods. - View data by month, quarter, year or multiple years.
You can have the Balance Sheet and the Income Statement for a month, quarter, semester, year or more years.
You can thus analyze in detail the period that interests you. - Compare the budget with the actual figures.
Using the same Chart of Accounts, the comparison between the forecast and the actual is immediate. You can easily identify deviations from the estimate. - Save the report settings (compositions).
Create reports and save the compositions to be recalled when you wish.
For each report you can select the layout that interests you. The program automatically adapts the prints without you having to set up rows, columns and formulas. You can analyze the data from different points of view, moving from one visualization type to another.
- View for a period.
The program presents you with reports for the year, but you can also request to have the forecast only for a quarter. You can easily switch between annual and multi-year planning. - Evolution over time.
The program is able to present all the reports with a breakdown by period. You can thus see the evolution over time of liquidity, Balance Sheet, sales, costs and operating result. You can easily switch between views without having to reset formulas or tables. - Fully customized reports.
You can select and change the view as you require. You can present your plans professionally and make a good impression on those who support you. - Save report setup.
You can create and save print settings and recall them when needed.
Simple use
Everything is already set up, you have to enter the forecast movements with simple transactions. This approach is particularly suitable for accountants, who are instantly are able to prepare precise and complete forecasts. Thanks to the income and expenses accounting, even people without particular accounting skills can do it.
- Entry as for accounting records.
For each future financial event, a transaction with date, description and the accounts that are concerned is inserted.
It is the program that totals the amounts by item and period, just like in accounting. - Indication of revenues and expenses in detail.
The different items of expenditure can be indicated in detail and at the exact moment in which they will occur. For personnel expenses, the salaries of individual employees can be indicated. - Easier changes and updates.
Adapting, adding or removing revenues or expenses is simple, because you just change the specific detail. If in the following year the rent increases, just change this item. If there is a new expense, a new line is added. The program will automatically update the budget.
Fast thanks to repetitions
Repeating operations are entered only once. The forecast movement indicates the frequency with which the operation will repeat itself and the program takes it into account for the future.
In a planning, there are many operations that repeat themselves. Comprehensive planning can be set up in no time. The repetition function is particularly effective when you have to adapt the budget, change a single amount and in an instant everything is updated.
Automation of calculations
The program automatically performs simple or complex calculations.
-
Calculation based on quantities and prices.
Sales quantities can be memorized to have a more concrete vision of the budget. The program automatically calculates the amount of the movement and updates the accounting. - Calculation formula (Javascript).
Banana Accounting provides an extremely powerful formula system, specially designed for financial planning. You have access to the budget data, so you can create movements that depend on previous events. You can calculate the depreciation based on the value of the investments made or calculate the interest on the loan based on actual use. The program after each modification will recalculate the exact values.
Formulas are expressions of the Javascript language, simple or complex schedules can be created, fully automated.- You can assign values to variables and recall them on subsequent lines.
- Javascript expressions have access to the Banana API.
- You can also program your own Javascript functions and call them up.
Automatic projections over several years
You can set the budget for one year and let the program create projections for the following years.
All reports such as liquidity plan, income statement and forecast balance sheet will also be available for subsequent years.
This way, a medium and long-term view of the financial situation are made available. The projection can be completely controlled for the following years as well. The operating logic is simple, for the operations of the year that will repeat themselves in the consecutive years, an annual repetition code is inserted. This way the program is able to project the planning data for the period in question. Schedules for two, five or even more years can easily be made.
Customer portfolio analysis and supplier control
When entering forecast movements, customer codes can be indicated. In this way, you can build realistic planning starting from your customer portfolio and understand if the costs will be covered and which customers will be more profitable and therefore pay more attention.
Obviously, the same analyzes can be done for suppliers.
Planning of projects or sectors
You can also create financial plans with reports by projects, activities or by business sectors. It is sufficient to indicate in the movements that an expense or income is relevant to a project or department and the program is able to automatically prepare specific reports.
Easy adaptation
You can adapt the structure of the Chart of accounts and the layout of the Balance Sheet and Income statement; add items and groups and reports change automatically, without having to add formulas to calculate row or column totals.
Comparison between the estimate and actual data
Accounting and budget use the same calculation and report preparation engine. In the transactions table, enter the values referring to the past and in the estimate, those of the future. The Chart of Accounts and the arrangement of the balance are always the same and comparisons and indications about any changes compared to the budget are automatically displayed.
Automatic data transfer to a new year
The budgets set up with Banana Accounting are easy to update and modify. Just change the relative movements and the program automatically recalculates the formulas and updates the budget.
When you create a new year, the program reports the budget data, changing the dates. It is then a question of modifying the elements that have changed since the previous year. This provides detailed and perfect planning for the following year.
Corporate financial simulation
Integrated planning in accounting is very powerful and opens a new era in business planning, as it offers the possibility to simulate the series of future events with great precision and in detail. Forecasts can be analyzed in detail with the same tools used for accounting analyzes; check what is the break-even point and analyze the situation of customers or projects.
Learning accounting with planning
By preparing the budget with transactions similar to accounting, one practices and learns the accounting technique. Accounting training courses can be made much more interesting and effective, because students can be offered the task of creating their own company and ensure to make it become solid and profitable. Students will not only have to practice entering transactions, but they will have to keep an eye on the activity and get used to reading the Balance Sheet and the Income statement.
Starting a financial forecast
You can easily prepare financial forecasts including liquidity plans, balance sheet and income statements.
The procedure is the same as for creating the accounting.
1. Create the accounting/forecast file
With the File → New command , create a financial forecast file, using the accounting type and the accounting template that best suits your needs.
You can also start by using one of the templates already prepared for learning, which also contain examples of budget transactions.
- Financial planning for the family (with the Cash Manager)
To plan your family's expenses and income. - Financial planning for the opening of a restaurant (Income and Expenses Accounting)
This template uses alphabetical account numbers, which make comprehension more immediate.
With income and expenses; even without accounting knowledge, you can create a professional planning, including the liquidity plan, asset forecasts, costs and income. - Financial planning for the opening of a restaurant (Double-entry Accounting)
For complete financial forecasts, with the double-entry bookkeeping system, intended for those who are familiar with the double-entry bookkeeping method.
This model uses alphabetical account numbers, which make it easier to understand.
There are also sample files for more advanced functionalities:
- Double-entry accounting, using the quantity and formula columns
The different possibilities of using the formula column are listed. With examples and explanations. - Multi-currency accounting with examples of budget transactions with formulas
To use multi-currency specific formulas. - With examples of transactions on more complex themes.
Once created you can save the file and give it a name, preferably composed of the company name and the year "company-2020.ac2".
2. Customize the file
Once you have created the file, adapt it to your specific needs:
- Set the File properties.
- The company name.
- The Accounting period.
Normally it is the one corresponding to the calendar year. However, you can indicate another one as needed. See Forecasts over several years.
- Customize the Chart of Accounts.
You can change the description, add or delete accounts or groups.
If necessary, you can adapt the Chart of Accounts at any time later. - If it’s an activity already in progress, enter the Opening Balances.
3. Enter financial budgeting movements
In the Budget Table you can now enter the financial forecast movements.
4. View the forecasts
The forecast data are visible:
- In the Charts window.
- In the Accounts table, in the Budget column.
- In the Reports, in the Budget column.
- In the Account card, Budget values.
Adapt the forecast
You can change, add or delete transactions at any time. The forecast will be immediately recalculated.
Add forecasting to an existing accounting file
The following explains how to add financial planning to an existing accounting.
Adding the Budget table to an existing accounting
The first step will be to Add the Budget table to your accounting file. At this point you will have the budget table available, where you can enter the financial forecast transactions.

Entering budget transactions
Having thus the accounts and the chart of accounts already set up, you can immediately start to enter the transactions in the budget table, also refer to Transaction examples.
Just follow the instructions and templates indicated in:
Budget table
Planning transactions are entered in the Budget table. It's setup is similar to the Transactions table you are using, but has specific columns that help speed up and make planning easier.
You can also modify the data as you wish, to display reliable forecasts that are always perfectly up to date.
Easy and comprehensive forecasts
- You can enter all the operations in detail.
- You have comprehensive forecasts because they are based on the double-entry method.
- Based on the transactions entered, the program calculates and displays the forecasts.
- Indicate when an operation will be performed, and if and until when it will repeated.
- The description is indicated.
- Indicate the account of origin and destination.
- Indicate the expected amount.
- You can complete the registration with:
- Customer account
- Accounts Payable.
- VAT code
- Cost / Profit Center
- Segments.
- Add more columns for additional information.
- You can enter the transactions in the order you want, so as to form groups.
- You can enter additional information to facilitate the transfer of data to the new year.
Adding and removing the Budget table
Financial planning is done by adding the Budget table.
If your accounting file doesn't have the Budget table yet, proceed as follows:
- Tools menu -> Add new functionalities command
-
Add Budget table
Warning: this operation cannot be undone. If you want to return to the previous version, keep a copy of the pre-existing file, or use the Remove Budget table function.
Thereafter, the program will:
- Add the Budget table, carrying forward the budget values indicated in the Accounts table.
- Lock the Budget column in the Accounts table.
The values of this column are being calculated according to the budget transactions, using the period defined in the accounting tab basic data.
Remove the Budget table
With the Add new functionalities ... command (in the Tools menu) you can also remove the Budget table.
Warning: This operation can not be undone. Once the command is executed all budgeted movements will be erased.
If you have the possibility to return to previous version, make sure to save a copy before executing.
Once the Budget table is removed, the Budget column will again be available for modifications in the Accounts table.
Budget table columns
The Budget table columns are very similar to the Transactions table columns. To facilitate understanding, letters have been used for account designation in the following example. Normally you would use your own account numbers.
Below you will find explanations for each budget column:
- Data
The future date when you expect the operation to take place:
If an exact date is not available, for example a monthly sales budget, enter the end of the month date. - Repeat
A repetition code is entered (for further information on use, also see Dates and Repetitions.- When the forecast is calculated, the program internally creates copies of the rows with the date set successively and based on the indicated repetition code.
- Blank, no repetition takes place.
- The initial row keeps the date indicated.
- The date of the copy lines is progressively increased as defined by the repeat code.
- If the repetition is monthly or yearly in the created lines:
- It is generally used on the same day as the column being used.
- If the day is greater than the number of cycles in the month, the last day of the month is used.
- If the end of month indication "ME" or "YE" is indicated, the last day of the month will be used.
- When the forecast is calculated, the program internally creates copies of the rows with the date set successively and based on the indicated repetition code.
-
- Basic codes for repetition:
- "D" for a daily repetition (Day)
- "W" for a weekly repetition (Week)
- "M" for a monthly repetition (Month)
- "Y" for a yearly repetition (Year)
-
- Multiples
If the code is preceded by a number, the repetition occurs with the multiplied frequency.- "2M" for bimonthly
- "3M" for quarterly
- "6M" for six months
- Repetition with a later date at the end of the period.
The "M" and Y "codes with the" E "at the end move the repetition date to the end of the month.- "ME" monthly repetition, but with a date at the end of the month.
If you enter the date 1.1.2022 the next date will be 28.2.2022 and the one after 31.3.2022
If the date is 28.2.2022, the next date will be 31.3.2022. - "3ME" for quarterly end of month
If you start on 30.6.2022, the next date will be 31.12.2022. - "6ME" for half-yearly end of the month
- "YE" each year, but at the end of the month.
If the date is 28.2.2015 the next date will be 29.2.2016. - "5YE" every three years, but at the end of the month.
If the date is 28.2.2015 the next date will be 29.2.2020.
- "ME" monthly repetition, but with a date at the end of the month.
- Multiples
- End (End date)
- Generally to be left blank.
- Enter the date after which there must be no repetition.
For a lease, the date on which the lease ends will be indicated as the final date.
- Variant
To indicate a possible variant relating to the budget, in combination with the extensions. - Management of a New Year
Indicate how the transfer should take place when a new year is created.- No value - the date is incremented by one year.
- "1" The date remains the same.
- "2" The transaction is not transferred to the new year.
- Debit and Credit Account, CC1, CC2, CC3
As in the Transactions table, the accounts in which the transactions are to be registered are indicated.
Segments and cost centers can also be used. This way, a budget may also be prepared for segments or cost centers. - Quantity
The quantity which, multiplied by the unit price, returns the total amount (see Quantity and Price columns) - Unit
A description referring to the quantity, for example: m2, ton, pcs. - Price/Unit
A description referring to the quantity, for example: m2, ton, pcs.- In the income and expense accounting, enter a negative value to have the amount entered in the output column.
- Formula (in base currency)
Allows you to enter calculation formulas, in Javascript, plus the programming functions of the Banana Apps.
If there is a formula (or any text), the value in the Amount column is set based on the result of the formula.
See the next points for how to use it.- In double-entry accounting, the result of the formula must always be a positive number.
- In the income and expense accounting, if the result is positive, it will be considered as an revenue, if negative as a cost.
- Amount (in base currency)
The amount that is used for the forecast.
In the event in the row includes a repetition, the amount of the first transaction is indicated. The amounts of subsequent repetitions are visible in the account card.
The amount is automatically calculated in the following cases:- If you entered a value in the Quantity or Unit price columns, the amount is calculated based on the contents of these two columns.
- In double-entry accounting, the result is converted into a positive value.
- In the income and expense accounting, if the result is positive, it will be considered as an revenue, if negative as a cost.
- If a formula has been entered, the amount will be the result of the formula.
The formula also has priority over quantity and price.
- If you entered a value in the Quantity or Unit price columns, the amount is calculated based on the contents of these two columns.
- Total
This is the total of the repeated row amounts that fall within the Accounting and Forecasting Period set in the file properties.
If there is no date or if the start or end date are outside of the accounting period, this column will remain empty.
- Basic codes for repetition:
-
Columns in income and expense accounting
-
For the Cash Manager and the Income and Expense Accounting, the amounts are indicated in the Income and Expense column.
- Revenue and Expense Columns
The budget amounts are entered in the income and expense columns. - Use of Quantity, Price and Formula columns
When the program automatically calculates the amount based on the Quantity, Price or Formula columns, the result will be entered in the Revenue column if it is positive, and in the Expense column if it is negative
In the Quantity and Price columns you can indicate a positive or negative value. -
-
Columns in multi-currency accounting
- Revenue and Expense Columns
Is the amount in the currency of the transaction account (see multi-currency transactions).
This amount is used to calculate the basic currency value at the indicated exchange rate.
If there is a formula, the value is the result of the formula calculation .
If the row includes a repetition, the amount of the first transaction is indicated. - Account currency amount formula
A calculation formula can be entered.
If the line includes a repetition, the amount of the first transaction is indicated. The amounts of subsequent repetitions are visible in the account card. - Exchange
It is the exchange rate that is applied to convert the amount into the account currency into the base currency. - Total currency amount of the account
Is the total of the amounts of the repeated lines in the currency of the account, whose date falls within the accounting period defined in the file properties
If there is no date or if the start or end date is outside the accounting period, this column will remain empty.
-
Financial Planning based on the double-entry method
By adding the Budget table to your accounting, you can set up a comprehensive and professional financial planning.
Financial Planning based on the double-entry method
The planning system of Banana Accounting is based on the same double-entry method used for accounting.
It is planned by always indicating an account of origin (credit) and one of destination (debit). This allows for a precise vision of the capital flows and offers the possibility to have a comprehensive vision which includes:
- Budget forecasts, therefore relating to the financial situation, liquidity, assets, third party and own means.
- Income statement forecast: revenues, costs and operating result.
Plan Execute Control
The planning of Banana Accounting is an integral part of the Plan-Execute-Control.
This offers a constant and dynamic control of the financial situation and evolution.

Planning and accounting in a single file
The same file contains both accounting and planning data. You can get started with a file prepared to keep the accounting and then add the schedule later, or you can start with a file to keep the planning and then also manage the accounting.
Common elements
- Basic accounting data
Header, currency, accounting period, address, other parameters. - Accounts and Categories table
Where to set up the Chart of Accounts with accounts and groups total.- Opening balances (Opening column)
They are inserted in the Accounts table and are used as the initial situation for both accounting (current values) and forecasts. - Annual Budget (Quote column)
- With the Budget table
The Budget column of the Chart of Accounts will be protected and the program indicates the budget amounts, calculated on the basis of the contents of the Budget table, referring to the accounting period. - If there is no Budget table
You enter the budget data manually.
When forecasting, the program generates the monthly value, dividing the annual value by the number of months of the accounting period.
- With the Budget table
- Opening balances (Opening column)
- The other tables
- VAT Codes Table
- Exchange rate table
Accounting data (past and present)
- The Transactions table
Where past (historical) movements are entered.
The Registration table is always present in the accounting file. If you don't use it, you can hide it - Current value (accounting, past and present)
This is the balance or movement of the period of an account or group.
In the reports, you can display the column of the Current value.
These are the values calculated on the basis of the accounting data, calculated taking into account the- Opening balances (Accounts table).
- The movements of the Transaction table
- Account card (historical)
These are the movements of an account or group prepared on the basis of the initial balances plus Transactions.
The Budget data
They are those used to make forecasts, budgets and schedules.
The term "Budget" is always used in the program for future data.
- The Budget table
Future budgeted transactions are inserted.
The method is the same as the one used in the Transactions table, there are the same columns, plus other specifications for planning.
Movements related to the future, included in the Budget table- Static values (as in the Transactions table).
- They use calculation formulas, which the program solves when calculating the forecast.
- Repetitive movements, which the program uses to automatically generate forecasts.
- The Budget value (future)
The forecasted value. In the reports you can display the column of the Estimate value, calculated taking into account- Opening balances (Accounts table)
- Transactions in the Budget table (if any).
- If the Budget table does not exist, using the value contained in the Budget column of the Accounts or Categories table.
- Budget Account card (future)
These are the transactions of an account or group prepared on the basis of the opening balances and budget transactions.
The Difference Budget values
Difference between the budget and current values (actual, final).
In the reports, there is a column for comparison, which displays the difference.
Mixed projection values (from a certain date)
The value at a certain future date calculated as follows:
- On the basis of current values and up to the indicated start date .
- Starting from the date indicated on the budget values.
Mixed projection values are only available through scripts and the web server.
Types of accounting
The accounting method chosen for accounting is used to insert budget transactions or movements.
- Income and Expense (Cash Manager and Income and Expense accounting)
- Doubl- entry (Double-entry and multi-currency accounting).
For budget calculations, the program internally always uses the double-entry based engine. The results and reporting that are obtained are therefore very similar.
Accounting, planning and forecasting period
Accounting or forecasting is always related to a period. The following periods are differentiated:
- Accounting period
Is the one defined in the file properties, with start and end date. - Budget period
It is the period for which the planning data is entered.. - Forecast period
It is the period used by the program to calculate the forecast. It is indicated when a print is requested.
For more information, see the Forecasting period.
Breakdown by period
With the double-entry method, each operation has its own date in the planning. When printing, the user chooses whether to have a forecast by month, quarter, semester or year, and the program will calculate everything automatically. Contrary to spreadsheets, there is no need, anymore to decide at the beginning whether to make forecasts by month, quarter or year and to divide the amounts manually in the columns.
Automatic projections
Thanks to the possibility of indicating that certain operations are repeated in the future, the program has the necessary elements to automatically prepare forecasts for future years. You can thus know how revenues, costs, liquidity and other assets and liabilities will evolve in the weeks, months, quarters and years to come
Details with all the operations
With the double-entry method, the forecasts are prepared by inserting transactions. The program is able to present the account card with the detailed movements for each account. This view is very useful for investigating elements and represents another advantage of liquidity-oriented planning, which is difficult to achieve with planning prepared with spreadsheets.
The calculation journal
The basis for all accounting and budget processing is the calculation journal. To prepare Financial Statements, Income Statement, Account Cards, VAT Reports, the program creates an internal data structure which is called a calculation journal. Movements are accessible through the API accounting with Journal function.
The logic for creating the calculation journal works as follows:
- It is created starting from the data entered by the user.
- For each financial movement, including also the opening balances, there is a row, where the main elements are:
- Origin
Indicates whether the transaction relates to accounting (current) or planning (budget). - Operation type
Opening balance, movement, carry forward, invoice compensation. - Date (the relevant date)
- Description
- Account
- Account Type
Indicates whether it is a normal account or a cost or profit center. - Amount (accounting base currency)
Positive values indicate an increase (debit), negative values indicate a decrease (credit) - Amount account currency
- Other columns
- All those that are present in the Transactions table.
- Several others that are used for calculations.
- Origin
The calculation log is emptied every time recalculation is performed and then the following are added:
- The lines of current transactions (relating to actual accounting).
- The lines of the budget movements.
The rows of current values (actual)
The rows for current values are added to the temporary journal starting from:
- Initial balances contained in the Accounts table
For each account with a balance, one row is created.- Date is the date of the start of accounting.
- Account is the account.
- The amount is the opening balance.
- Accounting movements from the transactions table.
If the movement has multiple accounts, debit account, credit account, VAT account, cost center, a row is generated for each account with the relative amount in positive or negative.
The lines of the budget values
The rows for the budget values are added to the temporary journal starting from:
- Initial balances contained in the Accounts table
As with accounting values, a budget line is created for each account with a balance.
- Planning movements (with the Budget table)
As for accounting, for each movement on the account, rows are created based on the Budget table.- Static ones, with all the values set.
- Repeated movements
- For the entire projection period defined, based on the repetition code, the program creates duplicates of the budget lines and sets the date.
- The program generates repeated rows based on the contents of the Start Date, End Date and Repetition columns
- If the projection period is the calendar year and in January there is the registration of the rent with monthly repetition, the program creates duplicates for the following 11 months.
- If the registration is on January 31, for the months that do not have 31 days, the day will be the last of the month.
- If the first registration is on March 28 and the repetition code is indicated as the end of the month, in the following months the day will become the last of the month.
- As for accounting entries, if there are multiple accounts on the budget row, one row is generated for each account.
- Movements starting from the annual Budget (if there is no Budget table)
If there is no Budget table, the budget rows are created based on the content of the Budget column of the Accounts and Categories table:- The number of months It is calculated how according to the accounting period.
- One row is created for each month.
- The amount contained in the Budget column is divided by the number of months.
- If there is a rounding difference, an additional row is created for the final month.
After creation, the rows are sorted by ascending order.
Amount column calculation
Once the calculation journal has been created, the contents of the amount column of all the budget rows which contain a formula or a quantity or unit price are recalculated.
Resolution of formulas in Javascript:
- Javascript interpreter creation
Every time the calculation journal is created, an instance of a Javascript interpreter, specific for the resolution of the Budget formulas, is also created - Javascript interpreter initialization
The Javascript interpreter is initialized by running scripts.- The default Banana Accounting scripts.
- The content of the _budget.js file possibly present in the Documents table.
This way the user can initialize variables or create his own calculation functions.
- Resolution of formulas
- The formulas contained in the rows of the temporary journal are solved one after the other in the progressive sequence of date.
- The state of the Javascript interpreter is maintained after each operation, therefore the formula can refer to variables defined in a row with a previous date.
- The formulas contained in the repetition lines are also executed by order of date, so the result varies according to when it is performed.
The calculation sequence is as follows
- The budget lines are processed by order of date (if they have the same date in the order of entry).
- The transaction amount is calculated, with this priority:
- If there is a formula by solving it
- If the quantity and the price are present, by multiplying them
- Otherwise the value contained in the amount column is kept.
- For multi-currency accounting, the currency amount formula is first performed and then the base currency amount formula.
If there is no formula for amount in base currency, the program reverts to the historical exchange rate and calculates the equivalent value in base currency. - For VAT accounting, VAT is recalculated based on the transaction amount.
- Previously processed rows are for calculations of subsequent rows.
- If you use a formula for calculating the balance for the whole year in a February transaction, you will only have the balance until February.
Calculation column Total Budget table
The Total column is calculated automatically and contains the total amount of the budget for the accounting period indicated in the file properties (start and end date of accounting).
- If it is a single transaction, the Total is equal to the amount.
- If it is a recurring operation, the Total is the sum of the amounts of all repetitions that fall within the accounting period.
- The Total column is empty if the date is preceding or goes beyond the accounting period.
Calculation of the current value, forecast and comparison
Once the calculation journal is generated, it is used to calculate the Balance Sheet and all the other processing necessary for accounting.
For the periods defined in the report, the program calculates:
- The current value (based on Transactions).
- The Budget values.
The following values are calculated for current and budget data:
- Balance at the beginning of the period.
- Debit movement
- Credit movement
- Movement (Total)
- Balance at the end of the period (Start + Movements)
The comparisons between Current and Budget are also calculated:
- Absolute Difference (Budget - Current).
- Percentage change
Automatic and manual recalculation
The budget values are automatically recalculated:
- If there is a change in the Budget table.
- If the accounting start or end date is changed.
- If the Accounts table is modified.
- When requesting a report and the Transactions table has been changed.
After each recalculation the program automatically updates:
- The Budget column in the Accounts and Categories table.
- The Total column in the Budget table.
If you modify the VAT table or the _budget.js file or other Javascript files that are used in the calculation of the formulas, you must perform a recalculation manually (Command check and control accounting).
The calculation speed depends on:
- Number of accounts and groups in the Accounts and Categories table
- Number of rows inserted in the Budget table.
- Number of rows with repetition.
- Presence of formulas.
- Schedule period set. The longer the period, the greater the number of repeat lines.
Manual recalculation
If the calculation takes a long time, it may prove difficult to enter data in the Budget table. You can switch to manual recalculation by checking the Recalculate totals manually option in the File Properties (from the File menu) Options tab.
To have the updated values, you must therefore use the Recalculate Totals command.
Period for the financial forecast
The planning system based on the double-entry method allows you to prepare forecasts indicating when the operation will take place.
Unlike Excel, where you set up a sheet with the columns for the forecast periods (month, quarter or year), with Banana Accounting you simply indicate the expected date for the event. The assignment to a period is generated automatically by the program when it processes the data. You can decide to display forecasts by day, week, month, 2 months, quarter, semester, annual, 2, 5 or 10 years.
- Forecasts can be made for one or more years.
- Based on the data entered, the program calculates the liquidity, Balance Sheet and Income statement projections for the period in question.
- Daily forecasts can be obtained, particularly useful for liquidity, or even by month or year.
See Prints and financial forecast reports.
Accounting, planning and forecasting period
Accounting or forecasting is always relevant to a period. The following periods are differentiated:
- Accounting period
This is the one defined in the file properties, with start and end date.
Generally, it will be the same as the calendar year, but it can have any start and end date. - Planning period
The period for which the planning data is entered.- The schedule does not require a planning period to be set.
- It is generally assumed that it is the same as the accounting period.
- The planning period may be different from the accounting period. In the Budget table, rows are inserted which take effect beyond the accounting period.
- Transactions with dates outside the accounting period.
- Repetitive transactions without an end date or with an end date that is beyond the the accounting period.
- Forecast period
The period used by the program to calculate the forecast.- It is indicated when a print is requested.
- Use the accounting period as default.
- It can be set freely and in this way forecasts can be obtained for several years and even for several decades.
- The accounting period is used as the Forecast period for the calculation of the content of the Total column in the Budget table and of the Budget column of the Accounts and Categories tables.
- These values therefore refer to the accounting period defined in the file properties.
- If you change the accounting start and end date, the forecasts are recalculated.
- It is indicated when a print is requested.
Forecast with monthly logic
Forecast movements are entered in the Budget table indicating the date on which these are expected to occur. For the purpose of liquidity forecasting, it is important to indicate dates for revenues and costs as precisely as possible.
For all other income and expenses that occur on a day of the month or rather at the beginning or the end, such as rent, wages, bank charges and other expenses or income, it is important to indicate by selecting the day close to the actual day of payment.
For other revenues and expenses, approximations will be made. For example - except in special cases - for restaurant revenues, which come in daily, it is not adequate to make day-to-day forecasts. In this case it is sufficient to indicate the overall sales that are expected to occur in the month. We recommend to indicate day 15, the middle of the month.
Forecast for the current year
Movements with or without repetition are inserted in the Budget table.
The calculation of the forecast is generally generated, taking into account the movements that fall within the current accounting period, as defined in the file properties.
- The total amount for the current period is indicated in the Total column of the Budget table.
- The estimate balance for the current period is indicated in the Budget column of the Accounts and Categories table.
- In the various printouts, if it is indicated as the All period, there are forecasts for the current period.
If the file is also used to keep the accounting, the accounting period must obviously be the one referring to the accounting. Even when the file is used for forecasts only, it is better to set the accounting period referring to only one year. In fact, if a period of two years is entered in the base data, the values of the forecasts, in the Total and Accounts column, will be for the two years. This can lead to confusing values.

Forecasts over several years
If you insert the forecast movements with a repetition code, the program is able to prepare forecasts that extend beyond the defined period.
To obtain forecasts over several years, the movements are entered in the Budget table.
- Opening balances
- These are inserted in the Accounts table.
- Forecast movements prior to the accounting period.
- For special cases, it is also possible to insert transactions with dates prior to the accounting period.
- Attention must be paid, because these operations will change the balances at the time of opening.
- For these transactions, the Total column will be empty because it is outside the accounting period.
- Forecast movements for the accounting period.
- Movements are indicated with the date falling within the accounting period.
- If there are operations that will also repeat in the following years, the annual repetition code must be set to "Y".
- If the repetition of the operation occurs during several years, indicate the number of years before the Y, i.e. for every 2 years indicate "2Y", 5 years "5Y", 10 years "10Y".
- If the repetition does not extend beyond a set date (for example the payment of a lease), the end date must be indicated.
- Forecast movements for the following years.
- The future date, on which the transaction is expected is indicated.
- The repeat code and the end date can be indicated.
- For these transactions, the Total column will remain empty because they are outside the accounting period.
Use of formulas
The formulas allow you to automate amortization and interest calculations. When an investment increases, the income statement is also immediately updated. Formulas are especially useful when making forecasts over multiple years.
You can use the formulas to automatically adjust the amount in the repeat rows .
- The calculation of depreciation can be based on the balance of the fixed assets account.
- Interest can be calculated directly on the bank account movements.
- You can determine a sales progression.
- Purchases can be defined as a percentage.
Print with the forecast period
Thanks to the fact that movements with the repetition code or with the dates of the following years have been inserted in the Budget table, the program is able to calculate forecasts for future years.
When the report is printed, indicate the start and end date in the Period section.
Considering that the start date is January 1, 2022:
- If you want a 2-year forecast, indicate the end date as 31 December 2024.
- If you want a 5-year forecast, indicate the end date as 31 December 2027.
- If you want a 20-year forecast, indicate the end date as 31 December 2042.
The possibility of getting a forecast is available for the following printouts:
All accounting reports can contain accounting values, forecast values, or both together. The parameters available are the same for accounting reports and forecasts.
Thanks to these reports, you may generate a Provisional Balance Sheet, Provisional Income statement, Liquidity planning, Investment planning, Financing planning and more, for future interest periods .
Columns divided by period
In the Subdivision section you can use the program to create columns for the period.
You can thus display the evolution by month, quarter or year.
With Composition you can set up print formats and call them up again later. If you run forecasts over several years, it is will be useful to have pre-set compositions, overall, per year, 5 years or with the comparisons between the final balance and the estimate, which can be called up immediately .
Budget - Three-year forecast
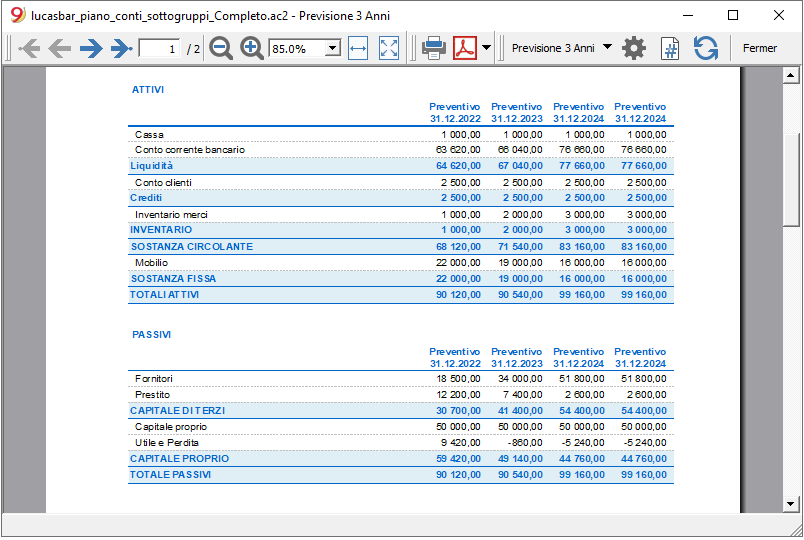
Income statement - Three-year forecast

Budget transactions
When preparing financial forecasts, based on the double-entry method, transactions are entered in the Budget table. Indicate origin and destination accounts for each one. The program has the information necessary to prepare Balance Sheets and Income statements, that will however relate to the future and not the past.
When one is planning with Excel, the Income statement is set up first, then the revenues and costs are listed. Generally, the liquidity and investment plan is prepared only later and on separate sheets.
When making forecasts with the double-entry method, we proceed instead as if we were keeping an accounting for the future. All the transactions that are expected to occur will be listed. The program will then automatically prepare the Balance Sheet and Profit and Loss account for the indicated period or periods.
Structuring of budget transactions
For the preparation of a financial plan, we generally proceed by listing the different elements in the following order:
- Capital injections.
- Third party capital injections.
- Setting up expenses.
- Investments.
In furniture, equipment. - Recurring fixed costs.
Rent, staff, social security charges, energy, subscriptions. - Recurring revenues.
- Variable revenues
The turnover which is typically seasonal. - Variable costs.
Commissions, costs of the goods sold and others, which are related to the expected volume of revenues. - Year-end transactions.
Depreciation, taxes, interest on loans, dividends.
By the time you enter sales and variable costs, you will already have the cost and capital structure. It will be possible to know instantly, whether the expected turnover will allow the company to generate sufficient profits and liquidity to guarantee its sustainability over time.
Amount and Formula column
As a rule, to prepare a budget, simply use the Amount column.
For more elaborate estimates, there is the possibility of indicating quantities, unit prices, or a formula. The program will automatically calculate the value in the Amount column.
Updating forecasts
With the double-entry method, thanks to the possibility of indicating each operation in detail, it becomes easier to update and improve the forecast. Initially, estimates of different costs or investments will be entered. As you get closer to the operational phase and there will be more precise data, just replace the existing ones. Even when the activity has started and exact elements are known, the forecast can be updated easily. Precise and reliable indications on profitability and liquidity are thus available.
Dates and repetitions in financial forecast transactions
The Data column
The value contained in the Data column is the one that will validate the forecast.
- If there is no date, the transaction will be taken into account at the beginning of the planning.
If you require a forecast indicating a period, the amounts will be taken into account in the balance value at the beginning of the period.
Due to the fact that it does not fall within the period, no amount will be displayed in the Total column. - Dates in the accounting period set in the file properties.
These are the ones commonly used. The total amount will be indicated in the Total column, taking into account repetitive movements, within the accounting period. - Dates prior to the period.
You can enter movements that precede the forecast period. However, you must be careful that they do not conflict with the opening balances entered in the account table.
Due to the fact that it is not within the period, no amount will be displayed in the Total column. - Dates after the period.
If you make forecasts over several years, they allow you to indicate transactions for the years to come.
Due to the fact that it is not within the period, no amount will be displayed in the Total column.
The End date
This is used in combination with repetition, to indicate the last date beyond which there is to be no repeat.
- Must generally be left empty.
If you enter a date when it is not necessary (for example the end of the accounting period) the forecasts for the following years will not include this operation. - For leasing transactions.
Indicate the date on which the payment of the last installment will be made as the end date. - For loan repayment.
Indicate the last expected payment date. - For changes in the amount at set deadlines.
In the case, for instance, that the amount of a recurring transaction is adapted at certain deadlines (salary increase).- Create a transaction row with repeat "M" and End date as per the last payment before the increase.
Create transaction rows with Data when the increase begins. - If the increase follows a precise and regular automation, this can also be programmed with formulas.
- Create a transaction row with repeat "M" and End date as per the last payment before the increase.
Repetitions
For recurring expenses or income, the repetition code is recommended (refer to Documentation on the columns).
- When calculating the forecast, the program creates copies of the operation and progressively increases the date, taking into account the indicated frequency.
- If there is no end date, the program will generate internal copies of the records for the entire period of the forecast indicated at the time of the report when calculating the forecast.
- If the start date is January, the frequency is monthly
- If the forecast period is the year, it will generate rows from February, 1 original row and 11 automatic rows, for a total of 12.
- If the forecast period is 10 years, it will generate rows starting from February, 1 original row and 119 automatic lines (11 the first year + 12 * 9 for the following ones), for a total of 120 lines.
- If the start date is January, the frequency is monthly
- If you want the program to automatically calculate forecasts for subsequent years.
- For recurring operations, indicate the relative repetition code.
- For transactions that occur only once a year (for example depreciation at the end of the year), indicate the repetition code "Y", so that the depreciation is also calculated in the following years.
- Don't use the repetition only if the operation will not occur in the following year.
Total column of the Budget table
The Total column is calculated automatically and represents the sum of the amounts of the current row and the repetition amounts that fall within the accounting period. The Total column is empty if the transactions have an earlier date or extend beyond the accounting period.
Schedule with precise date and monthly logic
Forecast movements are entered in the Budget table indicating the date on which these are expected to occur.
However, it is not always possible to predict all revenues and expenses with a daily precision. When making a forecast it is therefore useful, in some cases, to use approximations, generally reasoning on a monthly basis. In any case, it is useful to always follow a specific logic so that reliable liquidity forecasts can also be obtained in the short term:
- Punctual operations (capital payment, investments) are indicated with the date on which they are expected to occur.
If there is no precise date, it is useful to indicate them on the 15th day of the month in which they are expected to occur. - Recurring charges that have a precise payment date are to be set with the expected payment date and the relative repetition code:
- Bank charges, interest, amortization are to be indicated at the end of the month, quarter or year that they will take place.
- Rentals on the due expected date of payment.
- Salaries and social security charges
- For the calculation and monthly payment on the day that wages are paid.
- For thirteenths, bonuses or whatever at the moment they are paid.
- Payments for advances and adjustments of social security charges on the expected payment date.
- Payments and VAT adjustments on the typical payment due day.
- Revenue Forecasting.
The preparation of the forecasts depends on the type of activity.
If you do not know the exact day, but you will know that it will happen in a certain month, it is recommended to indicate the 15th of the month- Punctual revenue.
They are to be indicated on the date on which it is expected to take place or mid-month. - Recurring revenue.
To be indicated on the date of entry or mid-month. - In many cases a monthly forecast is well suited. The revenue can be indicated on the 15th of the month.
- If the revenues are recurring, the revenue can be entered with the monthly repetition. Using formulas you can predict growth.
- If there are seasonal differences, it is helpful to have a sales forecast row for each month.
- Forecast of projects or major works.
If there is a calendar with receipts, a transaction row is to be indicated for each expected entry. It can be approximated by indicating the 15th of the month. - Forecast for customers.
For a consultant or commercial advisor, who works both with budgets and projects, it can prove very useful to set up a detailed revenue forecast for each client, with the expected payment dates. This forecast will also be very useful to check if the customer has actually paid.
- Punctual revenue.
- Variable costs.
- Constant expenses linked to the turnover (a restaurant for example ), are indicated with the same date as the turnover. With a formula you can also calculate as a percentage value of the turnover.
- Costs can also be linked to other elements, such as the number of employees, rented premises or other.
Forecasting with the cash principle
Planning for small business and cash activities (such as shops, restaurants) it is useful to proceed with the cash principle, then indicate the revenues with the date on which they will be collected and the costs when paid.
For important operations, such as the purchase of a machine whose payment is deferred over time, it is however useful to insert forecast movements with precise details:
- Purchase of machinery (asset registration with suppliers) with date of purchase.
- Payment of the machinery, with the date(s) on which payment is expected.
Forecasts with the accrual method
In this case, the insertion of the operations takes into account when the payment will be made.
- Cash transactions.
They are obviously registered normally. - Transactions expected to be settled in the near future.
For simplicity, the operations that fall within the forecast month or the one immediately following, it can be useful to use the cash principle. - Deferred payments.
If the dates are not known with precision, you can use the 15th of the month.- Transactions with precise payment terms.
- One movement indicates the purchase date with the counterpart in the supplier account.
- One of the other movements indicates payment on the scheduled dates.
- Transactions with precise payment terms.
- Deferred collections.
- With precise payment terms, as is the case with a project:
- A movement indicates the billing date and the customer account with the counterpart.
- One of the other movements indicates payment on the scheduled dates.
- Late payment.
This is the case when a part of the revenues is collected in the short term, a percentage is collected later. It can be done like this:- Enter the revenue as cash collection.
- With the same date, a movement is created that moves a part of the collection to the customer account.
- At a later date, the cash collection is indicated with the client account of the counterpart.
- With precise payment terms, as is the case with a project:
- Use of variables for deferred collections and payments( see Example use of variables)
When the same value must be reused at the time of payment, it can prove very useful to use the formula column and variables.- In the billing transaction, the amount is assigned to a variable.
- In the payment movement, the variable is inserted so that the amount is automatically taken over.
- Variables can also be used to define the percentage of the amount that will be deferred, for example.
Esempi di movimenti di previsione finanziaria
I movimenti di pianificazione si inseriscono come delle normali registrazioni, con la data descrizione, importo, conto dare e avere.
In più si usa però il campo ripetizione, che consente di inserire le operazioni ricorrenti con una riga sola.
Qui di seguito sono elencati diversi esempi ripresi dal modello seguente a cui si rimanda per ulteriori spiegazioni.
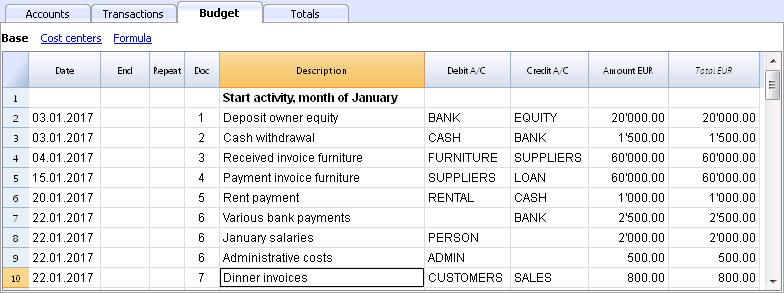
Normali registrazioni di previsioni
Si tratta di registrazioni di previsione che sono come delle normali registrazioni.
L'esempio qui indicato è riferita all'inizio dell'attività, quindi operazioni che non si ripetono.
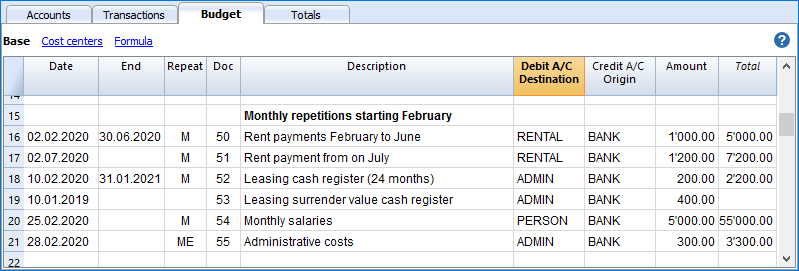
Registrazioni ripetitive mensili
Qui di seguito degli esempi di registrazione con ripetizione mensile, codice "M". La colonna Totale indica l'importo complessivo per l'anno.
Le prime due registrazioni si riferiscono all'affitto, che da febbraio a giugno è di 1'000 mensile, mentre da luglio è di 1'200.
C'é anche una data 2025, che è l'importo che si dovrà versare per il riscatto del leasing. In questa riga non vi è nulla nella colonna Totale, perché il movimento non rientra nelle date del periodo contabile definito nelle proprietà file.
Per le spese amministrative conteggiate dalla banca si è usato il codice ripetizione "ME" Fine mese (Month End). Per le registrazioni successive non sarà usato il giorno 28, ma l'ultimo giorno del mese, quindi marzo 31, aprile 30.

Fine trimestre
Qui indichiamo alcune registrazioni tipiche che si ripetono a fine trimestre. Inseriamo la ripetizione 3ME, che significa ripeti ogni 3 mesi, con data fine del mese.

Fine Anno
A fine anno ci sono delle operazioni. Qui usiamo il Ripeti "Y" in modo che queste operazioni saranno eseguite anche per gli anni successivi.

Previsione ricavi e acquisti merce
La previsione dei ricavi è specifica a ogni attività. In questo caso la previsione dei ricavi e degli acquisti viene indicata mese per mese, con un importo specifico.
A partire da marzo è indicata la ripetizione "Y" annuale, così che queste operazioni saranno ripetute negli anni successivi.

Ricavi anno successivo
I mesi di gennaio e febbraio nel primo anno di attività non erano considerati significativi per gli anni successivi, quindi non avevano una ripetizione.
Per i primi due mesi del secondo anno dobbiamo impostare le vendite. Mettiamo anche la ripetizione "Y" annuale così verranno ripetute l'anno successivo.

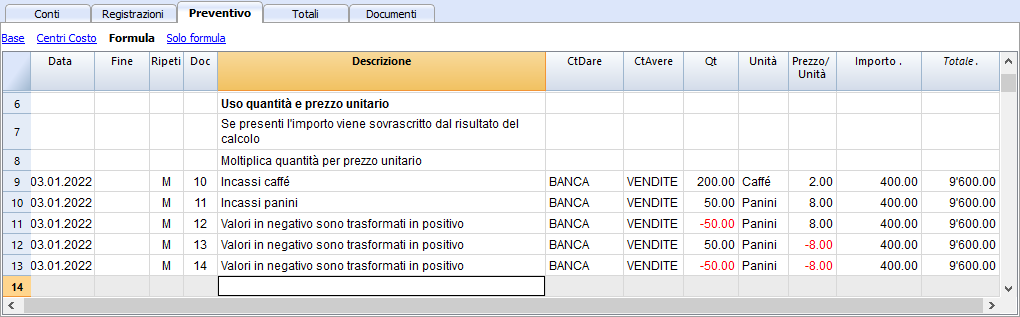
Forecasting with quantity and price
The Quantity, Unit and Unit Price columns of the Quotes table allow you to prepare forecasts faster.
The value of the Amount column is calculated by the program by multiplying the Quantity by the Unit Price (under the condition that Formula column is empty).
The Quantity, Unit Price columns are set as visible in the Formula View.
Advantages of using the Quantity and Prices columns
The quantity and price columns are useful for making predictions based on quantities. For example:
- In the Unit column you can indicate what the price refers to.
- The Quantity column indicates the number of seats served daily.
- The Price column indicates the estimated revenue for each cover.
- The Amount column will be calculated automatically based on the values indicated.
With this approach offers several advantages:
- All elements of the planning can be precisely detailed in the Budget.
- We remember the quantities and prices used to make the estimate.
- Changing the schedule is very simple, you can change the element you want only.
- How the profit varies, can be seen with a change in the quantities sold or in the price.
Break-even analysis.
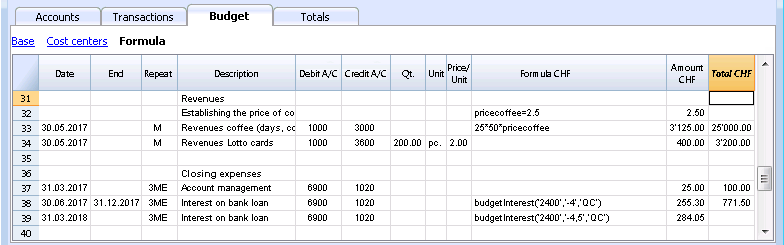
Javascript formulas in the Budget table
Javascript formulas in the Budget table
The Formula column allows you to enter calculation formulas. The estimate amounts can thus be calculated on the basis of other values of the same budgeting.
- Indicate the cost of goods based as a percentage of sales.
- Increase your sales budget based as a percentage of growth.
- At the end of the year, calculate the depreciation based on the value of the investments made.
- Quarterly, calculate interest on the bank account based on actual usage (days / 365).
- Monthly, calculate interest on the bank account based on actual usage (days / 365).
If you enter a value in the Formula column, the Amount column is calculated by the program based on that formula.
The following functions can be used in the Formula column of the Budget table.
Example files
For examples of the formulas, refer to the following explanations:
- Template with transactions using the Quantity anf Formula columns.
- Template with transactions for Multi-Currency accounting using the Formula column in the base currency.
- Also refer to Examples of using formulas in financial forecasts.
Calculation formulas in Javascript
- The formula must be expressed in the Javascript language (not to be confused with the Java language).
- If there is a formula (or any text), the value in the Amount column is set according to the formula result.
- You can use all the functions of the Javascript language, plus the APIs provided by Banana.
Decimal separator
In JavaScript only the point "." is used as a decimal separator
If you use a different separator, the one used for numbers in the local format, the number is likely to be truncated.
Calculation sequence and lack of future values
For more information on the calculation sequence, see Planning Logic.
- The rows are sorted by date and arranged starting from the lowest.
- If there are rows with the same date, the order is that of insertion.
- When a row is resolved and the following rows have not yet been processed, with the formulas you will only have access to the data up to that moment.
Amount = result of the last instruction
In Javascript the semicolon ";" is used to separate expressions.
If the Javascript formula contains multiple expressions separated by ";" the value of the Amount column will be the result of the last executed expression.
- 10*3 //30 will be returned
- If there is a sequence of several operations separated by a semicolon ";", the last operation will be resumed.
10*3;7; //7 will be returned - If there is a return, the value is resumed after the return.
return 10; // 10 will be returned.
Variables
Javascript variables are the most powerful elements of programming, as they allow you to access the computer memory with a name, save and access those values.
Variables do not exist in Excel formulas, but are similar to the name of the cells, with the difference that the name can be freely assigned.
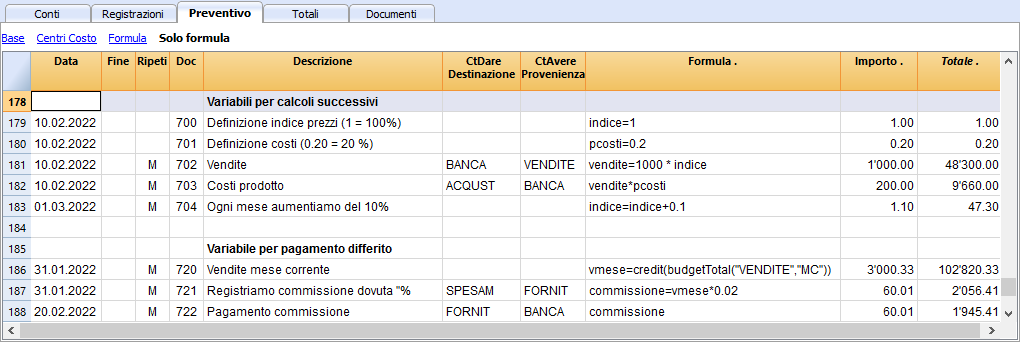
The variable is created by indicating a name and indicating with the equal sign.
You can define and use variables directly within the rows. By entering the variable name in the formula, the saved value is taken over.
The price variable is created here and the value 10 is assigned.
var price = 10;
or simply
price = 10;
below we create a total variable to which the price value multiplied by 5 is attributed.
total = price * 5;
The value of the variable can be reassigned.
price = 20;
Objects
Javascipt objects are variables that allow you to save multiple values, each indicated with a property.
The prices object is created below, indicating the curly brackets. To access and save the values, instead use the square brackets or indicate in the name of the property after the name of the object.
prices = {}
prices['car'] = 10;
prices.car = 10;
prices['computer'] = 20;
prices.computer = 20;
Array
Javascript Arrays are created using square brackets and also to access them.
The first element of the array has index 0.
costs = [1,2,3];
costs[0]=3;
result = prices['car'] - costs[0];
Automatic variables
- budgetCurrent
It is a table that contains the budget rows after the repetitions creation.
These are used to record values in conjunction with the JRepeatNumber. - DEBUG is a variable that can be "true" or "false".
If "true", in the messages, all the results of the formulas are being displayed. - row
Is a Javascript object that refers to the current row.- The values of the cells can be retrieved with the value function ("columnNameXml").
row.value("date") returns to the date of the transaction. - row.value ("JRepeatNumber") returns the progressive of the repetition.
The first repetition is 0.
- The values of the cells can be retrieved with the value function ("columnNameXml").
Budget Functions
In addition to the budget API defined in the accounting class API, there are specific functions.
budgetExchangeDifference (account, [date, exchangeRate])
This formula recalls the Banana.document.budgetExchangeDifference function.
BudgetGetPeriod(tDate, period)
This function is used in combination with the use of repetition.
When repetitions are indicated, it is advisable to refer to a calculation period and not to a precise date.
- Parameter tDate.
The date to which the calculation of the period refers. Usually the date of the recording line. - Period parameter.
Abbreviations- For the current month
- "MC" current month
- "QC" current trimester
- "YC" current year.
- For previous month
- "MP" previous month
- "QP" previous quarter
- "YP" previous year.
- In the Experimental version (starting from version 9.1) can also be used
- "DC" current day
- "DP" previous day
- "WC" current week
- "WP" previous week
- "BC" current bi-monthly (2 months)
- "BP" previous bi-monthly
- "SC" current half-year
- "SP" previous shalf-year
- For the current month
- Returned values.
An object composed of two dates- startDate
- endDate
// example
t = BudgetGetPeriod ('2015-01-01', 'MP') returns
t.startDate // 2014-12-01
t.endDate // 2014-12-31
Specific budget functions
The following are similar to those available with Banana.document, but can be used without indicating the object Banana.document.
To be taken into account:
- Instead of the startDate parameter, you can use one of the abbreviations "MC", "MP", explained in the budgetGetPeriod.
- If you use an abbreviation, the function calculates the start and end date of the period, based on the date of the current registration.
- It makes sense to use the end date only if it is earlier than the row date.
If it is equal or higher, it has no effect because the values after the current row are not yet available, because they have not been processed. - If the registration row date is April 15th:
- budgetBalance("1000","MP") the balance of the 1000 account returns at the end of March.
- budgetBalance("1000","MC") returns the balance at the current time is the same as budgetBalance("1000").
- budgetTotal("1000","QP") returns total of the movement for the previous quarter.
- budgetTotal("1000","QC") returns the total of the movement for the previous quarter, up to the current date.
budgetBalance(account, startDate, endDate, extraParam)
The balance up to the current row.
budgetBalance('1000', 'MP'); //returns the balance of 1000 at the end of the previous month
budgetOpening(account, startDate, endDate, extraParam)
The balance at the beginning of the period.
budgetTotal(account, startDate, endDate, extraParam)
The difference between the debit and the credit movement of the period.
budgetTotal('1000', 'MC'); //returns the total movement of the 1000 account for the current month
budgetInterest( account, interest, startDate, endDate, extraParam)
Calculates the interest on an account, for the period indicated (at the maximum the current date)
If you use it to calculate interest on an account at the end-of-period, the row where the formula is shown should always be the last one for this date.
- account parameter
This is the account number on whose movements interest will be calculated - interest parameter,
Indicates the interest rate in percent.- Positive (2.5, 4, 10) calculates the interest on the account's debit movement
- Negative (-2.5, -4, -10) calculates the interest on the account's credit movement.
credit(amount)
-
If the amount parameter is negative returns the amount as a positive
credit(-100) // returns 100 - If the amount parameter is positive, returns 0 (zero)
credit(100) // returns 0
This function is useful in conjunction with the other budgetBalance functions to work only on the balances you need.
If you want to calculate the percentage on sales, using this function is easier.
credit(budgetTotal('1000')) // enter the value only if it is a negative.
debit(amount)
-
If the amount parameter is positive, returns the amount
debit(100) // returns 100 - If the amount parameter is negative, returns 0 (zero)
debit(-100) // returns 0
Useful if you have to make calculations using only the debit amount and avoid using the credit amount
include
Includes and executes a Javascript file, with the possibility to create its own functions and variables that can be recalled in the script.
- include "file:test.js"
Executes the contents of the indicated file. The name refers to the file on which one is working. - include "documents:test.js"
Executes the contents of the text document contained in the documents table.
This has to be a file of the "text/javascript" type.
Functions for multi-currency accounting
They can also be used for accounting without multi-currency, in this case the account is always in basic currency.
budgetBalanceCurrency(account, startDate, endDate, extraParam)
The balance in the account currency up to the current line.
budgetOpeningCurrency(account, startDate, endDate, extraParam)
The balance in the account currency at the beginning of the period.
budgetTotalCurrency(account, startDate, endDate, extraParam)
User defined functions
The user can define personal function with the JavaScript language, and recall them in the formulas.
It is possible to define functions:
- Directly in a formula
- In a JavaScript coded attachment; this attachment must have as row id the "_budget.js" name
- In a text of the Documents table, that needs to be included with the Include command
function Taxcalculation(profit)
{
   var percentage = 10;
   if (profit > 50000)
      percentage = 10;
   else if (profit > 100000)
      percentage =20;
   return profit * percentage / 100;
}
Examples of the use of formulas in financial forecasts
Below you will find some examples of how to use formulas to automate financial forecasts.
Please refer to the specific documentations:
- Javascript formulas in the Budget table
- Templates with transactions using the Quantity and Formula column

Parameters
When planning, it can be useful to define variables that can and will be used later.
It is useful to create a parameter section with a posting date of January 1st, or another date that corresponds to the first day of the Budget. The parameter variables will then be used in the following rows.
// 30%
costOfGoodsSold = 0.3
// 5%
interestRateDebit = 0.05
// 2%
interestRateCredit = 0.02
// 10 %
latePaymentPercentage = 0.1
This way, all parameters that can be set are displayed instantly. When a parameter is changed, the forecast is recalculated.
Repetitions or values per month
By using the repeat column, you can plan for the whole year on one recording row.
If however, the activity has seasonal variations, it is recommended to use a forecast by month. For each month, a row is created with the sales amount for the month.
If you wish to make forecasts automatic for several years, it is useful to insert the repetition "Y" in this row, so that the row of the year is also used for the next one.
Prices and sales quantities
When making a sales plan it will be easier to enter values using the quantity and price column. For example, a restaurant can enter the number of covers served per day, week or month and the program automatically calculates the amount. By changing the number of covers or the price, the impact on liquidity and on the result for the year is instantly displayed.
Use of formulas with variables for growth
Use formulas, which are expressed in the Javascript language:
- The variable must be defined before being used, hence the line, in which it is defined, must be a date preceding the the line in which it is used.
- Thousands separators in numbers can't be used.
- The decimal separator is always the "." (Full stop)
- The names are different for uppercase / lowercase.
You can assign a value to a variable (this name can be freely chosen) and enter the variable name in the following lines to resume the value.
By changing the value assigned to the variable, all the lines, in which the variable is used, are automatically modified.
As an example, you may set the expected sales amount, proceeding with the following months, by using a formula to increase the amount.
- Create a "S" (sales) variable , by entering the following text in the Formula column.
Sales=1000
The value 1000.00 will be inserted in the amount column - In the following lines use the variable by simply inserting the variable name in the formula:
Sales
The value 1000.00 will be inserted in the amount column - You can add 10% to the amount (multiplying by 1.1)
Sales*1.1
The value 1100.00 will be inserted in the amount column (The value of the Sales variable does not change) - You can increase the value of S
Sales=Sales+200
The value 1200.00 will be inserted in the amount column (The value of the Sales variable will change) - If the variable is used in the following line, there will be the new calculation
Sales
The value 1200.00 will be inserted in the amount column
You can also define a variable to define the percentage of growth.
- Percentage=1.1
- Amount=200
- In formulas you can use the variable name instead of the number
- Sales*Percentage
- Sales=Sales+Amount
Variables and repetitions
Let's say you expect the turnover to rise by 5% every month.
- Enter two lines where you assign the value to the variable, without putting any account with the start date of the year.
Sales=1000
Increment=5 - Then create a line with the repetition where you enter the accounts and the formula
Sales=Sales*(1+Increment/100)
Each time the row is repeated the value of the variable S will be increased by 5% and consequently also the amount of the transaction. By simply changing the growth percentage, the forecast will be recalculated.
In a row you can also insert multiple Javascript instructions, by separating them with a semicolon ";"
Sales=1000; P=5
Use of budget formulas
There are functions that allow you to access the balances and movements of the accounts for planning up to the row that is calculated.You can enter a formula that through the budgetTotal function, recovers the value of the sales account "SALES" of the previous month.
credit( budgetTotal("SALES", "MP") )
The budgetTotal function takes account numbers and periods as arguments. An abbreviation can be used instead of the period.
- MP stands for previous month.
- QP stands for previous quarter.
Revenues show in Credit, therefore the value returned by the function will be negative and will not be accepted as an amount in the double entry accounting.
Therefore use the credit () function, which uses the negative value and turn it into a positive value.
Variables for monthly sales
Sales may vary for each month. In this case it is useful to use separate registrations for each month with the variable name.
sales_01 = 1000
cost_01 = sales_01 * costOfGoodsSold
sales_01 = 1100
Deferred payments
If you want a very precise liquidity plan, it is useful to separate the sales, which are paid immediately and those that are deferred.
One approach may be to record all sales as if they were paid cash, assigning the value of the monthly variable to the amount.
sales_01 = 1000
A registration is then entered, which reverses the sales that are deferred, calculating the amount with the formula.
sales_01 * latePaymentPercentage
A payment registration with the same formula will then be inserted for the following month.
Selling costs
There are costs that can be related to sales (cost of goods) or to other costs (social charges, in relation to wages).
Cost calculation with variables
If the sales are defined with variables, the sales costs can also be indicated as a percentage of the sales.
- You can define variable S for sales and variable C for the percentage of the cost.
Sales=1000
Cost=60 - The formula for the calculation will be:
Sales*Cost/100
You can also use the same approach to calculate social security charges.
This formula can possibly be entered in a repetitive row.
Sales cost calculation with budget functions
When the costs are related to sales, the budget formula can also be used.
credit( budgetTotal("SALES", "MC") )*60/100
When the costs related to sales, "MC" stands for the current month.
This formula will return the sales value of the current month, turn them into a positive and multiply them by 60 and divide by 100.
The date must be beyond the sales registration dates, obviously.
It may be used it in a repeat row, inserting the month end date. Therefore, the costs of the sale will automatically be calculated based on the sales entered with the transaction.
The formula can be combined with variables.
- At the beginning of the year define the percentage of costs.
Cost=60 - Therefore, the formula C is used.
credit( budgetTotal("SALES", "MC") )*Cost/100
When you change the contribution percentage or any sale, the schedule will be updated automatically.
Sales commission calculation at the end of the year
At the end of the year, you calculate the commissions of 5% on the total net sales with this formula:
credit( budgetTotal("SALES", "YC") )*5/100
The bugetTotal function returns the movement of the sales account for the period "YC", current year. With the credit () function, the amount is turned into a positive value and then multiplied by 5 and divided by 100.
If you make forecasts over several years, remember to insert the repetition "Y" in the row, so that the same formula will be also calculated for the previous year. As indicated above instead of entering the 5 directly in the formula, you can assign it with a variable.
- Commission=5
- credit( budgetTotal("SALES", "YC") )*Commission/100
If the percentage changes from one year to the next, it is sufficient enter a transaction with the following year date that resets the variable for commissions.
Inflation with variables
If you want to forecast over several years, you can also take inflation into account.
- At the beginning of the planning, assign a base variable for prices and inflation (2%).
Base=1;Inflation=2 - When you use the Sales variable, you multiply it by the inflation rate
Sales=Sales*Base - At the beginning of the following year, with annual repetition, you increase the price base
Base=Base+Base*Inflation/100
Depreciation calculation
Thanks to the formulas, the calculation of depreciation can be automated.
If you change the value of your investments in planning, depreciation will be automatically recalculated. Make sure that the date of the depreciation calculation line has a date superior to that of the investments. Date is generally 31st December .
Depreciation calculation on book value
To calculate the depreciation of the "EQUIPMENT" account, insert a line at the end of the year with the following formula and the debit and credit accounts appropriately set up to register the depreciation.
budgetBalance("EQUIPMENT")*20/100
The budgetBalance function returns the balance to that date. The amortization of 20% is then calculated on this.
Use the debit function, in case you think the asset account can go into credit.
debit(budgetBalance("EQUIPMENT"))*20/100
Calculation of depreciation on the initial value
To calculate the initial value of the investments, it is necessary to use variables to remember the value of the initial investment.
Equipment=10000
If the depreciation is spread over 5 years, the formula will be inserted in the year-end depreciation line
Equipment=10000/5
The annual repetition "Y" and the end date, which corresponds to the date of the last installment of the amortization, will be inserted in the row to prevent the amortization from running on indefinitely.
For each investment you will have to create a variable and a specific row of depreciation. Numbers can also be entered in variable names.
Equipment1=10000
Equipment2=5000
Interest calculation
The budgetInterest( account, interest, startDate, endDate) function allows you to automatically calculate interest based on the actual use of an account.
The parameters are:
- Account
Whose movements are used to calculate interest, in case it will be the bank account or the loan. - Interest
The interest rate in percentage.
If the value is positive, interest on the debit balances is calculated.
If the value is negative, interest on the credit balances is calculated.. - Initial date, which may also be an acronym.
- End date, which may also be an acronym.
- The returned value is the interest calculated for 365/365 days.
Interest expense on the bank account
To calculate the interest expense of 5%, insert a line with the end date of the quarter and the repetition "3ME", which contains the formula
budgetInterest( "Bank", -5, "QC")
The interest rate is negative, because "QC" means current quarter. The debit and credit accounts must be the usual ones for recording interest expense. If the interest decreases the bank account balance will also be used in the registration. However, another account can be used if it is paid with another account.
It is important that the "3ME" repeat is used so that the date used will always be the last of the quarter.
To calculate the interest of the month use the abbreviation "MC"
budgetInterest( "Bank", -5, "MC")
Interest on the bank account
For interest income of 2%, use positive interest instead.
budgetInterest( "Bank", 2, "QC")
Interest on fixed-term loan accounts
For fixed-term loans, interest will be calculated and recorded on the specified date.
- Create an separate account for each loan.
Use the budgetInterest function indicating exactly the start and end dates .If the date is indicated as text, the notation "yyyy-mm-dd" should be used, then "2022-12-31" - Use variables.
As indicated for depreciation, the loan amount can be assigned to a variable. The interest calculation will be done with a Javascript calculation formula,- Define the loan variable
Loan=1000 - 5% interest calculation, for 120 days.
Loan*5/100*120/365.
- Define the loan variable
Profit tax calculation
Profit is the total of the group's profit for the specified period.
To calculate a 10% profit tax, use the following formula.
credit(budgetTotal("Gr=Result","MC"))*10/100
- Use the the budgetTotal function parameter in the "Gr = Result" group, which indicates that instead of an account it has to calculate the movements for the group.
- MC, current month, is indicated as the period.
- The budgetTotal function will return a positive value if there is a loss and negative (credit) if there is a profit.
- the credit function takes only negative values into account, therefore if there is a loss the tax will be zero.
Payments with deferred or different deadlines
For deferred payments or with different deadlines, you can proceed in two ways:
- Use variables to which payment amounts are to be assigned.
Use the variable in question when recording the payment. - Create customer or supplier accounts for different credit deadlines.
Other cases
Please tell us about your other requirements, so we can add more examples.
Planning Settings
Adding a Budget table
Proceed by Adding a Budget table if the accounting file does not yet contain it.
Planning only
Accounting and planning are kept in the same file. However, it is however possible to manage the Budget only, by simply not inserting rows in the Transactions table.
- For a Startup
- For the preparation of the financial plans for a new firm, with not yet started financial plans.
- Initially, if you are working at the level of ideas it might be useful to select a model with few accounts, without VAT.
- If you plan to keep the accounting as well, it will be useful to start out with a Chart of Accounts already set up for a real company.
- For an existing firm
- Accounting is kept with another program.
- The Chart of Accounts will be modeled on that used for accounting.
- To compare with the actual accounting data:
- You can export the budget data and import it into the accounting program.
- You can export the accounting data and import it into the budget file.
- You can create Excel spreadsheets and report planning and accounting data.
Set up a planning
The procedure is the same, whether you manage one accounting on a standalone basis, only one budget or both together:
- Create an accounting file
- Set up the file properties
- Set up the Chart of Accounts
- Enter opening balances (if available)
- Enter the forecast values in the Budget table.
The Transaction table, however, remains preset, if you do not wish to display it, use the Data Menu -> Tables setup ... and tick the Transactions table as not visible.
Planning period
It is not necessary to define the planning period. You can set up the planning for one year and and also get forecasts for the following years.
Annual planning
As a rule, the planning is prepared for the accounting period defined in the file properties, which generally is identical to the calendar year.
- The opening balance at the beginning of the period is entered in the Opening column of the Accounts table.
- The budget data for the current year is entered in the Transactions table.
When requesting Reports, the program uses the accounting period, if a different period is not specified.
When you want to plan for the following year, you create a file for the new year. The program shows the budget postings, which can then be modified (see Create new year ... in Account2 menu).
Multi-year planning
With Banana Accounting you can have planning over several years available. The planning period is free, at the moment you request the report and set the Forecast period.
To make a planning over several years, generally proceed by setting the planning for the first year, then extending it for the following years.
Technically, therefore, proceed as if you were making an annual plan, extending it for the following years:
- In the file properties, the date of the first year (which is generally the calendar year,) is indicated as the start and end date.
- The opening balances are entered in the Chart of Accounts.
- The movements of the planning are inserted in the Budget table
- The operations that are specific to the first year only, when they are indicated without repetition.
- Indicate the repetition code for all other operations, which are presumed to repeat also in subsequent years.
- Operations that take place only once a year are indicated by the annual "Y" repetition code. For example, the calculation of depreciation, that is done at the end of the year.
- Specific operations for subsequent years are indicated with the respective date on which they occur.
- For repetitive operations that are limited to a single year or to a specific period (fixed-term leasing transactions) the End date will be indicated. After that date, no repetition will be made.
- Formulas may be used to make the amount to repeat automatic in the row .
- The calculation of depreciation can be based on the balance of the fixed assets account.
- Interest can be calculated directly on the movement in the bank account.
- A progression of sales can be specified.
- Purchases can be defined as a percentage of the cost.
- To obtain the planning (Enhanced Balance Sheet/with groups Report, Accounting reports, indicate the start and end date of the required budget.
Changeover to the new year
The Banana Accounting function for Creating a new year ... also carries forward the budgeting records.
- At the level of each row you have the possibility to indicate whether the operation should be carried over or not, and whether the original data should be kept or replaced by that of the new year.
- Creating the budget for the new year is therefore very simple, because it is only a question of changing the items of expenditure and income that are expected to change.
Reports financial forecasting
Provisional Balance Sheet
The Balance Sheet forecast displays the Balance Sheet for a future period. It is an important tool for tracking the management of your company and allows you to verify what the company's capital structure will be like, the state of assets, of liabilities and the equity.
With Banana Accounting, thanks to the forecasting with the double entry method, you have complete forecast budgets and that you can arrange in different ways. The program also calculates forecasts over several years.
You can access a very precise vision of what the future balance sheet will look like.
The structure of the budget is the same as that used in the accounting file. When printing, you can indicate which values to display, those of the final balance, the estimate or both of those.
The forecast values are calculated taking into account the opening balances and forecast movements indicated in the Budget table. When you change a budget entry, the forecasts are instantly updated. You can simulate and test, relocate a payment, add an investment, modify sales and see how the budget changes over time.
Budget forecast values can be displayed in several ways.
Detailed forecast
The financial forecast, based on the double entry method, allows to obtain the forecasts of the balance sheet values, using the same accounts and groups as those of the accounting file. The same structure of the items that make up the financial statements is used for forecasting. Values and reports are available automatically to display in detail, day by day, how liquidity evolves, the situation of customers.
The Banana Accounting forecast presents the values for assessing the financial, equity and economic situation. The structure is customizable, it can be presented in a simple way, including the main groups and the accounts that are part of it, or in a more complex way, by inserting subgroups, for a more detailed view.
ASSETS
Current assets
- Liquidity
- Credits
- Inventory
Fixed assets
- Movable assets
- Real estate
LIABILITIES
Third party capital
- Short term debt
- Long term debt
Own capital
- Reserves
- Profit/Loss previous years
- Profit/Loss current year
Account table
In the Budget column of the Accounts table you access forecast values for all accounts and balance groups available. In a glance you have an instant overview of the budget. The values refer to the accounting period and the variations are calculated automatically with respect to the current balance.
If you need more details, you can add accounts or groups.

Enhanced Balance sheet with groups
Through Enhanced Balance Sheet with groups command, you can view the Provisional Balance Sheet, choosing the presentation mode you need.
- Indicate the values of the Budget in the columns section.
You can display the current (accounting) values, the estimate values or both. - Set up the Period.
If a period that exceeds the accounting period, is indicated, the program will automatically switch to budgeting over several years. - Indicate the subdivision by period required.
- In the Rows section, you can exclude accounts and thus have a view of groups only.
- If you think you're use this print setting again, create a Composition.
Using the different options you can customize your prints. Below are some examples.
Forecast balance sheet at the end of the current year
This print has been set up with the figures for the current year only.

Forecast budget and comparison with the current year
The final (current) figures are compared with those of the estimate.
You can also view the variation as an amount and a percentage.
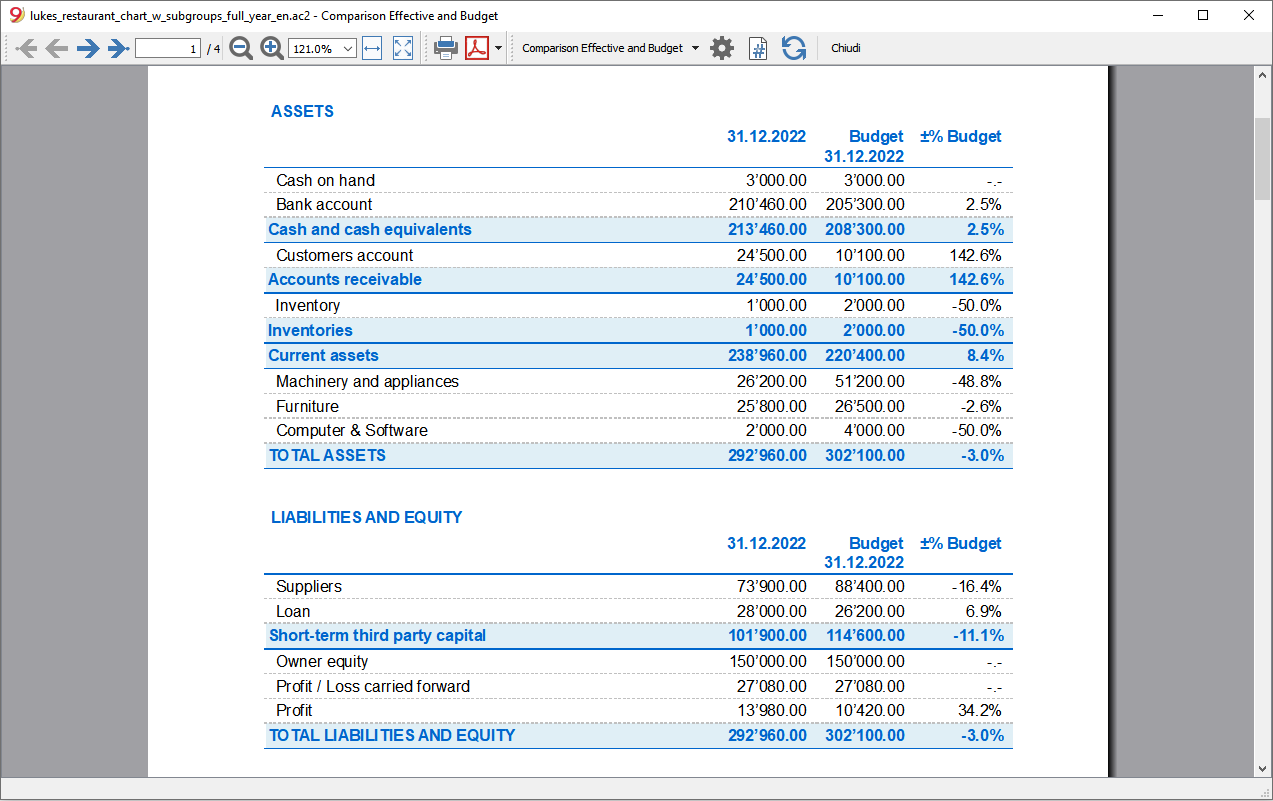
Quarterly budget
In the Subdivision section set to quarterly and the schedule shows the budget at the end of each quarter.
The evolution of the budget forecast during the year can be tracked.

Quarterly budget with comparison
This printout is set up to print both the estimate and the final balance. We therefore have the expected and current situation at the end of each quarter.

Three-year budget
This printout is set up to print the three-year budget forecast.
In the Period section set the reference period to three years and in the Subdivision section set to one year. In the File properties (File menu) there must be 3 years as the start and end period (e.g. start 01.01.2022 - end 31.12.2024).

Accounting Report
The Accounting Report is similar to the one for Enhanced balance sheet with groups, with the difference that the display takes place in the Accounts table in columns.
You can therefore use it to get an instant view of the evolution of liquidity accounts.

Provisional Profit and Loss account
The Income statement forecast presents the profits, costs and result for a future period. It is an important tool for tracking the management of the company which allows you to understand how the financial situation will evolve.
With Banana Accounting, thanks to the forecasts with the double entry method, you have complete forecast budgets and that you can organize in different ways. The program also calculates forecasts over several years.
You can have a very precise vision of the evolution of the economical situation.
The structure of the Income statement is the same as that used in accounting file. When printing, you can indicate which values to display, those of the final balance, or the budgeted balance or of both.
The forecast values are calculated taking into account the opening balances and forecast movements indicated in the Budget table. When you change a budget entry, the forecasts are instantly updated. You can simulate and test, relocate a payment, add an investment, modify sales and see how the budget changes over time.
Income statement values can be displayed in several ways.
Use of quantities and formulas
The quantity and price column of the Budget table allow you to prepare more realistic forecasts, using the same methodology as spreadsheets. This allows for faster simulations. It is sufficient that you change the price and you access the new forecasts of the income statement automatically and also those of the Balance Sheet and Liquidity.
The formulas allow you to automate cost calculation, so that for example, when you change sales the purchase costs change in percentage. In this way you can use precise income statement forecasts that update automatically. Formulas are particularly useful when making forecasts over multiple years.
Detailed forecasts
The Income statement forecast, based on the double entry method, allows you to obtain the forecasts of the costs and revenues, using the same accounts and groups as those of the accounting file. The same structure of the items, that make up the income statements, is used for forecasting. Values and reports are available automatically to display in detail, day by day, how liquidity evolves and the situation of customers.
The structure of the Chart of Accounts, on which the forecast is also based, is customizable. This can be done by simply using the main groups and the accounts that are part of it, or more in a more complex way, by also inserting subgroups, for a more detailed view.
The structure of the Profit and Loss Account is gradually scaled and allows you to view the interim and final results for the year after paying the taxes.
INCOME STATEMENT
- Revenues.
- Cost of goods.
Gross operating result (total of Revenues and Costs).
- Staff costs
- General costs.
Operating result (total of the gross operating result, personnel costs and general costs).
- Financial costs.
Operating result before taxes and depreciation(Total of operating result and financial costs).
- Depreciation.
Operating result before taxes (Total of ordinary Result and Depreciation).
- Taxes
Profit and Loss before Taxes (total of the Result before taxes and Taxes and duties).
Accounts / Category Table
In the Budget column of the Accounts table, for double entry accounting, and of the Categories table for revenue and expenditure, the forecast values for all the accounts and groups of the Income statement are displayed. With a glance you have an instant view of the forecasted Income statement. The values refer to the accounting period and the variations are compared to the current balance.
If you require more details, you can add accounts or groups.

Enhanced Balance sheet with groups
Through Enhanced Balance Sheet with groups command, you can view the Provisional Balance Sheet, choosing the presentation mode you need.
- Indicate the values of the Budget in the columns section.
You can display the current (accounting) values, the estimate values or both. - Set up the Period.
If a period that exceeds the accounting period, is indicated, the program will automatically switch to budgeting over several years. - Indicate the subdivision by period required.
- In the Rows section, you can exclude accounts and thus have a view of groups only.
- If you think you're use this print setting again, create a Composition.
Using the different options you can customize your prints. Below are some examples.
Forecast balance sheet at the end of the current year
This print has been set up with the quote values for the current year only.

Forecast income statement and current year comparison
The final (current) values are compared with those of the forecast.

Quarterly forecast income statement
In the Subdivision section set quarterly and the program shows the forecast income statement for the various quarters.
The evolution of the budget forecast during the year will now be displayed.

Quarterly budget with comparison
This printout is set up to print both the estimate and the final balance. We therefore have the expected and current situation at the end of the quarters.

Three-year forecast for Profit and Loss account
If you insert the forecast movements with the repetition code, the program is able to prepare forecasts beyond the defined period.
To obtain forecasts over several years, the transactions are entered in the Budget table with repetition (Y).
The printout is set up to obtain the estimate of the income statement over three years.

Accounting Report
The Accounting Report is similar to the one for Enhanced balance sheet with groups, with the difference that the display takes place in the Accounts table in columns.
You can therefore use it to get an instant view of the evolution of liquidity accounts.

Liquidity Planning
Cash is King is the motto that indicates how important liquidity is. It is the main engine for carrying out business activities, meeting commitments and producing profits. To invest safely, it is essential to evaluate the ability to produce liquidity and its evolution over time a rational way.
The financial forecast of Banana Accounting is an important business management tool, which allows you to understand if there will be enough financial means to meet commitments and reduce your debt exposure to the maximum.
Liquidity projections are calculated on the basis of the initial balance and forecasts included in the Budget table. When a budget movement is changed, the forecasts are instantly updated. You run simulations, assign a payment, add an investment, modify sales and see how liquidity evolves.
Liquidity values can be displayed in several ways.
Accounts table
Set up accounts and liquidity groups in the Accounts table. In the Budget column you will also see the updated forecast balances for the accounting period. At a glance you will know what the liquidity situation will be at the end of the year.

Evolution graphs
When you open the Graphs window, positioning the cursor on an account or a group you will see the graph of the evolution of Liquidity.
If you click on the Current, Previous or Estimate caption, you can hide the graph.
Account card with estimate data
Using Account card command you have the possibility to see in detail, day by day, how liquidity evolves. You can see all the movements that have an impact on liquidity.

The Account card command allows you to specify if you want to see current or budgeted movements.
- Select budget movements.
- Set the period
If you indicate a period that exceed the accounting period, the program will automatically generate Forecasts over several years. - If you indicate a group, you will see the movements of all the accounts belonging to that group.
- When you are in the Budget table, you can access the account card with a click on the icon next to the account.
Enhanced Balance sheet with groups
Through Enhanced Balance Sheet with groups you may select to work with values subdivided by column per period. In this way you can see the evolution of liquidity by day, week, month, quarter, semester, year, etc.
- In Columns section indicate that you wish to view the Budget values.
- In Sections you can select the accounts or groups you want to include in the printout.
You may select to display the asset and depreciation accounts only. - Set up the Period.
If a period that exceeds the accounting period, is indicated, the program will automatically switch to budgeting over several years. - Indicate the subdivision by period required.
- If you think you're use this print setting again, create a Composition.

Accounting Report
The Accounting Report is similar to the one for Enhanced balance sheet with groups, with the difference that the display takes place in the Accounts table in columns.
You can therefore use it to get an instant view of the evolution of liquidity accounts.

Forecasting sales
Sales for a company are the main source of income and liquidity. Unlike costs that are more easily planned, sales are more difficult to budget. As a rule of thumb, you may base yourself on the figure of the sales of the previous year for the same period or, on the possibility important events that are in the pipeline and could lead to an increase in sales or even to the acquisition of new customers.
Based on this concept, Banana accounting, with the forecast based on double-entry accounting, allows you to simulate and project different scenarios over time. Just change the budgeted amounts for sales and the program automatically updates the forecasts and displays detailed reports for the current year or for future years.
The sales projections are calculated on the basis of the forecasts included in the Budget table and can be displayed in different ways.
Accounts table
Set up accounts and sales groups in the Accounts table. In the Budget column you will also have the updated forecast balances for the accounting period. You can check what the evolution of sales will be during the year, at a glance

Evolution chart for sales
If you display the Graphs window, position the cursor on an account or a group and you will see the graph of the evolution of the sales.
If you click on the Current, Previous or Budget caption, you can hide the graph.
Account card with Budget data
With the Account card you are offered the possibility to display in detail and day by day, how sales evolve. You can examine all the movements that impact sales.

The Account card command allows you to specify if you want to display current or budgeted movements.
- Select thebudget movements.
- Set the period.
If you indicate a period that extends beyond the accounting period, the program will automatically generate Forecasts over several years. - If you indicate a group, you will see the movements of all the accounts belonging to that group.
- When you are in the Budget table, you can access the account card with a click on the icon next to the account.
Enhanced Balance sheet with groups
Through Enhanced Balance Sheet with groups you may select to work with values subdivided by column per period. In this way you can see the evolution of liquidity by day, week, month, quarter, semester, year, etc.
- In Columns section indicate that you wish to view the Budget values.
- In Sections you can select the accounts or groups you want to include in the printout.
You may select to display the asset and depreciation accounts only. - Set up the Period.
If a period that exceeds the accounting period, is indicated, the program will automatically switch to budgeting over several years. - Indicate the subdivision by period required.
- If you think you're use this print setting again, create a Composition.

Financial forecasting for customers
Customers forecasting completes financial planning with customer data. For example, a company can forecast sales by indicating accounts for the most important customers.
Forecasting with the double entry method also allows you to indicate accounts for individual clients. Depending on the requirement, customer management can be done with balance sheet accounts, profit and loss accounts or with cost and profit centers.
When changing a budget movement, the forecasts for each customer are also updated individually.
Accounts table
Set up accounts for customers in the Accounts table. In the Estimate column you will also have the updated forecast balances for the accounting period. At a glance, you can view what the forecast for the individual customer will be.

Evolution chart
If you display the Graphs window, positioning the cursor on an account or a group you will see the graph for the evolution of the customers.
If you click on the Current, Previous or Estimate caption, you can hide the graph.
Account card with estimate data
With the Account card command you have the possibility to see in detail all the movements for each customer.

- Select budget movements.
- Indicates the customer's account.
- Set up the period.
If you indicate a period that extends beyond the accounting period, the program will automatically generate Forecasts over several years. - When indicating a group, you will see the movements of all the accounts belonging to that group.
- When in the Budget table, you can access the customer's card with a click on the small icon next to the account number.
Enhanced Balance sheet with groups
Through Enhanced Balance Sheet with groups you may select to work with values subdivided by column per period. In this way you can see the evolution of liquidity by day, week, month, quarter, semester, year, etc.
- In Columns section indicate that you wish to view the Budget values.
- In Sections you can select the accounts or groups you want to include in the printout.
You may select to display the asset and depreciation accounts only. - Set up the Period.
If a period that exceeds the accounting period, is indicated, the program will automatically switch to budgeting over several years. - Indicate the subdivision by period required.
- If you think you're use this print setting again, create a Composition.
Accounting Report
The Accounting Report is similar to the one for Enhanced balance sheet with groups, with the difference that the display takes place in the Accounts table in columns.
You can therefore use it to get an instant view of the evolution of liquidity accounts.

Financial forecasting for suppliers
Supplier forecasting completes financial planning with supplier data. For exa, a company can plan purchases by indicating purchases by indicating accounts for the most important suppliers. It will thus be able to analyze and optimize the relationship with the various suppliers, perhaps by requesting payment extensions.
Forecasting with the double entry method also allows you to indicate accounts for individual suppliers. Depending on the need, suppliers management can be done with balance sheet accounts, profit and accounts or with cost and profit centers.
When changing a budget movement, the forecasts for each individual supplier are also updated.
Accounts table
Set up accounts for suppliers in the Accounts table. In the Estimate column you will also have the updated forecast balances for the accounting period. At a glance you can know what the forecast for the individual supplier will be.

Evolution chart
If you view the Graphs window, positioning the cursor on an account or a group you will see the graph for the evolution of the suppliers.
If you click on the Current, Previous or Estimate legend, you can hide the graph.
Account card with estimate data
With the Account card command you have the possibility to see in detail all the movements for each supplier.

- Select budget movements.
- Indicates the supplier’s account.
- Set up the period.
If you indicate a period that extends beyond the accounting period, the program will automatically generate Forecasts over several years. - When indicating a group, you will see the movements of all the accounts belonging to that group.
- When in the Budget table, you can access the customer's card with a click on the small icon next to the account number.
Enhanced Balance sheet with groups
Through Enhanced Balance Sheet with groups you may select to work with values subdivided by column per period. In this way you can see the evolution of liquidity by day, week, month, quarter, semester, year, etc.
- In Columns section indicate that you wish to view the Budget values.
- In Sections you can select the accounts or groups you want to include in the printout.
You may select to display the asset and depreciation accounts only. - Set up the Period.
If a period that exceeds the accounting period, is indicated, the program will automatically switch to budgeting over several years. - Indicate the subdivision by period required.
- If you think you're use this print setting again, create a Composition.
Accounting Report
The Accounting Report is similar to the one for Enhanced balance sheet with groups, with the difference that the display takes place in the Accounts table in columns.
You can therefore use it to get an instant view of the evolution of liquidity accounts.

Investments Planning
The investment plan presents the expected evolution of the equipment, stocks, movable or immovable values that are necessary for the company.
With Banana Accounting, thanks to the forecasting with the double-entry method, you can track what the evolution of assets will be over time. You generate comprehensive forecasts, which you can organize in different ways. The program also calculates forecasts over several years.
The structure of the accounts is identical to the one used for accounting. When printing, you can indicate whether to select which values to display, the final ones only, the forecasted ones or both together.
You also have the Income statement forecasts, so you can display the evolution of amortization and interest. When a budget movement is changed, the forecasts are immediately updated. You can run simulations, assign a payment, add an investment, change sales and see how asset accounts evolve.
For the Investment Plan, you have the same options as in the Liquidity Planing and the Provisional Profit and Loss Account.
Using formulas
The formulas allow you to automate calculation of depreciation and interest. When you increase an investment, the Income statement will also be instantly be updated. Formulas are particularly useful when making forecasts over multiple years.
Chart of Accounts
In the Budget column of the Chart of Accounts the forecast values for all accounts and balance groups are displayed, and therefore, for all those relating to investments equally. With a glance, you have an instant view of the values referring to the accounting period.

If you require more investment details, you may add accounts or groups.
Evolution graphs
If you view the Graphs window, positioning the cursor on an account or a group you will have the graph of the evolution of the investments.
If you click on the Current, Previous or Estimate caption, you can hide the graph.
Account card with estimate data
Using the Account card command, will offer you the possibility to see in detail, day by day, the evolution for each asset and the depreciation accounts. You can check all the movements that have an impact on investments.
The Account card command allows you to specify if you want to see current or budgeted movements.

- Select budget movements.
- Set the period
If you indicate a period that exceeds the accounting period, the program will automatically generate Forecasts over several years. - If you indicate a group, you will see the movements of all the accounts belonging to that group.
- When you are in the Budget table, you can access the account card with a click on the small icon next to the account.
Enhanced Balance sheet with groups
Through Enhanced Balance Sheet with groups you may select to work with values subdivided by column per period. In this way you can see the evolution of liquidity by day, week, month, quarter, semester, year, etc.
- In Columns section indicate that you wish to view the Budget values.
- In Sections you can select the accounts or groups you want to include in the printout.
You may select to display the asset and depreciation accounts only. - Set up the Period.
If a period that exceeds the accounting period, is indicated, the program will automatically switch to budgeting over several years. - Indicate the subdivision by period required.
- If you think you're use this print setting again, create a Composition.

Accounting Report
The Accounting Report is similar to the one for Enhanced balance sheet with groups, with the difference that the display takes place in the Accounts table in columns.
You can therefore use it to get an instant view of the evolution of liquidity accounts.

Corporate financing plan
The corporate financing plan presents the expected evolution of the accounts relative to the origin of third party and own capital.
With Banana Accounting, thanks to the forecasting with the double-entry method, you can track what the evolution of assets will be over time. You generate comprehensive forecasts, which you can organize in different ways. The program also calculates forecasts over several years.
The structure of the accounts is identical to the one used for accounting. When printing, you can indicate whether to select which values to display, the final ones only, the forecasted ones or both together.
Income statement forecasts are also available, so you can display the evolution of depreciation and interest. When a budget movement is changed, the forecasts are immediately updated. You can run simulations, assign a payment, add an investment, change sales and see how asset accounts evolve.
For the Investment Plan, you have the same options as for the Liquidity Planing and the Provisional Profit and Loss Account.
Using formulas
The formulas allow you to automate calculation of depreciation and interest. When you increase an investment, the income statement will also be instantly be updated. Formulas are particularly useful when making forecasts over multiple years.
Chart of Accounts
In the Budget column of the Chart of Accounts the forecast values for all accounts and balance groups are displayed, and therefore, also for all those relating to investments. With a glance you get an instant view of the values referring to the accounting period.

If you require more investment details, you may add accounts or groups.
Evolution graphs
If you view the Graphs window, positioning the cursor on an account or a group you will see the graph of the evolution of the corporate finances
If you click on the Current, Previous or Estimate caption, you can hide the graph.
Account card with estimate data
Using Account card command you have the opportunity to see in detail, day by day, The evolution for each asset and on the depreciation accounts. You can see all the movements that have an impact on investments.
The Account card command allows you to specify if you want to see current or budgeted movements.

- Select budget movements.
- Set the period
If you indicate a period that exceed the accounting period, the program will automatically generate Forecasts over several years. - If you indicate a group, you will see the movements of all the accounts belonging to that group.
- When you are in the Budget table, you can access the account card with a click on the icon next to the account.
Enhanced Balance sheet with groups
Through Enhanced Balance Sheet with groups you may select to work with values subdivided by column per period. In this way you can see the evolution of liquidity by day, week, month, quarter, semester, year, etc.
- In Columns section indicate that you wish to view the Budget values.
- In Sections you can select the accounts or groups you want to include in the printout.
You may select to display the asset and depreciation accounts only. - Set up the Period.
If a period that exceeds the accounting period, is indicated, the program will automatically switch to budgeting over several years. - Indicate the subdivision by period required.
- If you think you're use this print setting again, create a Composition.
Accounting Report
The Accounting Report is similar to the one for Enhanced balance sheet with groups, with the difference that the display takes place in the Accounts table in columns.
You can therefore use it to get an instant view of the evolution of liquidity accounts.

Project planning with profit and cost centres
Financial planning of projects allows you to take control over the income and expenses of a project. It is used to evaluate investments and returns on a project and to track its implementation.
Budgeting with the double-entry method allows you to indicate profit and cost centres as well. You only need to set up cost centers for the different projects, and in parallel to the balance and income statement forecasts, you will have the forecasts available for each individual project.
The projections are calculated on the basis of the initial balance and the forecasts entered in the Budget table. When a line is changed the budget, forecasts are instantly updated. You can produce simulations, reassign a payment, add an investment, modify sales and spot how the budget changes.
Values of liquidity can be displayed in several ways.
Chart of Accounts
Profit and Cost centres are set up in the Chart of Accounts. In the Estimate column you will also have the updated forecast balances for the accounting period. At a glance you can know what the liquidity situation will be at the end of the year.

Evolution chart
In the Graphs view window, position the cursor on an account or a group and a graph of the evolution of the projects will be displayed.
Clicking on the Current, Previous or Estimate legend, you can hide the graph.
Account card with budget data
With the Account card command you have the possibility to display all the movements for the single project in detail.

- Select budget movements.
- Indicate the cost or profit center.
- Set the period.
If you indicate a period that extends beyond the accounting period, the program will automatically switch to Forecasts over several years. - When you indicate a group, you will see the movements of all the accounts belonging to that group.
- When in the Budget table, you can access the cost center tab by clicking on the small icon next to the account number.
Enhanced Balance sheet with groups
With the Enhanced Balance sheet with groups you choose to divide the values into separate columns for each segment. Thus, you dispose of a view of the evolution of individual projects by day, week, month, trimester, semester, year etc..
- Indicate that you wish to display the Budget values in the Columns section.
- In Sections you may choose to view the the cost and profit centres only.
- Set up the Period.
If you indicate a period that extends beyond the accounting period, the program will automatically switch to Forecasts over several years. - Indicate the required subdivision by segments.
- If you think of continuing to use this print setting, create a composition.

Accounting report
The Accounting report is similar to the Enhanced balance sheet with groups, with the difference, that the display takes place in columns.
It can therefore be used to display an instant view of the evolution of the segments.

Planning with segments per sector and branch
The financial planning by sectors allows you to run budget and income statement forecasts for each sector or branch of the company. It therefore allows you to evaluate the various sectors of the company and understand what contribution each of them brings to the overall activity.
Budgeting with the double-entry method permits you to designate segments as well. When you set the segments for the different sectors, use them when you enter the budget movements and the budget and income statement forecasts will be made available, divided by the different sectors.
The projections are calculated on the basis of the initial balance and the forecasts entered in the Budget table. When a line in the budget is changed , forecasts are instantly updated. You can produce simulations, reassign a payment, add an investment, modify sales and spot how the budget changes.
Values of liquidity can be displayed in several ways.
Chart of Accounts
Segments are set up in the Chart of Accounts. When indicating the segments for the Balance Sheet and Income statement accounts, the balance of the segment will always result as zero in the accounts.

Account card with budget data
With the Account/Category cards command you have the possibility to examine all the movements for each segment in detail.
- Select budget movements
- Indicate the required segment.
- Set the period.
If you indicate a period that extends beyond the accounting period, the program will automatically switch to Forecasts over several years. - If you indicate a group, you will see the movements of all the segments belonging to that group.
- When you are logged in the Budget table, you can access the cost center tab with a click on the small icon next to the account number.

Enhanced Balance sheet with groups
With the Enhanced Balance sheet with groups you choose to divide the values into separate columns for each segment. Thus, you dispose of the Balance Sheet and Income statement for each sector.
- Indicate that you wish to display the Budget values in the Columns section.
- In Sections you may choose to view the balance sheet or income statement only.
- Set up the Period.
If you indicate a period that extends beyond the accounting period, the program will automatically switch to Forecasts over several years. - Indicate the required subdivision by segments.
- If you think of continuing to use this print setting, create a composition.

Accounting report
The Accounting report is similar to the Enhanced balance sheet with groups, with the difference that, the display takes place in columns.
It can therefore be used to display an instant view of the evolution of the segments.

New year for financial forecasting
The function to Create a New Year also takes up the budget movements.
For each row in the table Budget, in the For New Year column, you have the possibility to indicate:
- Whether the operation is to be copied over or not,
- If the date is to be kept or replaced with the date of the new year.
Creating the budget for the new year is therefore simple, because you have to modify or add the expense and income items that are expected to change.
Annual budget in columns (Accounts and Categories tables)
It is possible to manage the budget by indicating the amount of the annual budget for each account in the Accounts and Categories table. There are at least two approaches:
- Enter the data in the existing Budget column.
If the accounting does not have the Budget table, the Budget column in the Accounts and Categories table is editable. - Add other columns to insert the budget values.
Editable budget column
If the accounting does not have the Budget table, the Budget column in the Accounts and Categories table is editable. If the file contains the Budget table and you don't need it, you can remove it with the following command:
- Tools menu → Add new functionalities → Remove Budget table.
Once the Budget table has been removed, in the Accounts and Categories table, Budget view, the Budget column is activated and values can be entered.
As a rule, only the budget for income and expenses is indicated (or in double-entry accounting, costs and revenues).
The budget values must be entered on each account; the program calculates the totals automatically, and generates the profit or loss.
- For double-entry accounting, the Revenue (Credit) must be entered as a negative in the Accounts table. Costs (Debit) as a positive.
- For Income and expense accounting, in the Categories table, the revenues must be indicated in positive and the costs in negative.
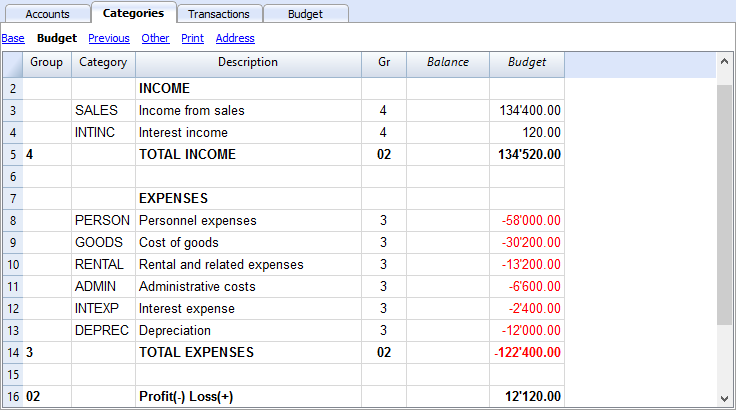
Budget Difference column
In the Budget Difference column, the program will calculate the difference between the balance and the value in the Budget column.
Print per period
When printing by month or quarter, the program divides the value indicated in the Budget column into monthly quotas.
The program proceeds as follows for subdivisions:
- The number of months, based on the start and end date indicated in the accounting properties (File menu -> Properties and basic data), is calculated.
- The budgeted amount is divided by the number of months calculated.
- Any rounding differences will be added to the last month.
If, for example, you have indicated an amount of 10'000, this will be divided into 11 monthly amounts of 833.33 and one salary of 833.37.
If a quarterly preview has been selected, the value of the quarter will be the sum of the individual months and not the value of the year divided by quarters.
If you want a different planning by month or quarter, you should use the planning with the Budget table.