Cash Flow Statements and Financial Ratios [BETA]
Cash Flow Statements and Financial Ratios [BETA]Easily add advanced financial reporting and charts to your existing double entry accounting. It works with any accounting plan, the first time you enter your groups/accounts in the settings dialog, and then all calculations and reporting will be done automatically. This extension is available in Banana Accounting Plus only with the Advanced plan. Update now!
How to start
First time setup:
- Open Banana Accounting Plus
- Open your existing Banana double entry accounting file.
- Go to the Extensions menu → Manage Extensions... command and install the Cash Flow Statements and financial Ratios extension.
- Map you accounting plan.
- Extensions menu → Cash Flow and Financial Ratio → Settings.
- Under Grouping enter the groups you have in your accounting plan in the predefined groups.
The extension uses a standard, simplified Balance and Profit and loss structure, that allows to automatically calculate the Financial Ratios. - Click OK to verify your data.
Check the Ignore warnings/errors if you want to save the data and complete the grouping later.
- Add information to some special transactions (dividends, change in reserve, disinvestment, investments) they can be identified for the Cash Flow Statements.
Run the reports (at any time).
- Open your Banana double entry accounting file.
- Menu Extensions → Cash Flow and Financial Ratio
- Financial Charts
- Financial Reports
Available reports and charts
- Reclassification and checks
- Reclassified balance sheet
- Reclassified Profit and Loss Statement
- Control sums
- Cashflow Statement
- Cash Flow statement based on the indirect method.
- Cash Flow ratios.
- Financial ratios and analysis
- Liquidity ratios:
- Financing ratios
- Profitability ratios
- Efficiency ratios
- Dupont Analysis
- Altman index
- Charts
- Evolution of ratios over time
- Evolution of the Reclassified balance sheet
- Evolution of the elements of the Reclassified Profit and Loss Statement.
Prerequisites
In order to be able to use this extension you have to:
- Use Banana Accounting Plus with the Advanced plan. We recommend using the Dev-Channel, some features or functionality present in the insider version may not yet be accessible in the regular version of Banana.
- Open a Double-entry accounting file.
It is important that the various accounting years files included in the analysis have the chart of accounts set up in the same way, at least as far as references to groups are concerned.
For example, if I want to analyze the accounting years: 2018, 2019, 2020, and I set up group 100 in the Liquidity grouping. I need to make sure that for all three years the group is the same.
Try the extension now
You have the opportunity to use a test accounting file with some random entries to get an idea of the extension's functionality. The file already includes the extension, so you don't even have to download it
You can test it by editing the transactions, the chart of accounts or the various settings in the dialog.
The accounting file does not exceed 70 transactions, so you can also try it out with the free or professional version and upgrade to the Advanced plan later.
Compare historical data over more years and forecast data with current year.
Introduction
What is exactly the financial statement analysis?
Financial statement analysis is an accounting tool that provides an assessment of a company's economic, financial and asset condition. It is based on the financial statements and reports the data. It contains the profits and losses of a company and therefore serves to derive the general performance of the company.
Why is this activity very important for your SME ?
Until recently there were few SMEs that often used a financial statement analysis as larger companies could use it.
Today, times have changed. Reading the numbers well can make a difference within the strategy and management of an enterprise. Understanding which products it is worth investing in and which jobs can be neglected determines the difference between the growth or decline of a company.
This activity can be a source of interest for various subjects, external or internal to the company. Entities or external individuals can analyse their solvency profile (current or potential lenders), capacity to provide an adequate return on capital (for those who want to buy shares for example) or even just obtain information on the company's situation with respect to competition in the sector.
Through the comparative balance sheet analysis of the various elements available, it is possible to arrive at the following formulation of a "judgement" on the health of the company in all its dimensions:
- Economic
- Asset
- Financial
How it works
The financial statement analysis is based on two fundamental documents for a company:
- The Balance sheet
- The Profit and loss statement
In order to perform a correct analysis, it is always necessary to start from the reclassification of the accounts, which includes 3 phases in particular.
- Group the account items into groups
- Order such groups
- Bringing out intermediate results
The reclassification allows for a slightly cleaner first view of the company's situation and is already useful information can be obtained from it.
Analysis by Indexes
Once the intermediate results have been obtained, it is possible to proceed with the calculation of the indices useful for the analysis. The financial statements analysis by means of indexes is a very powerful tool that allows you to use indicators capable of providing a very concise assessment of one's own situation.
How should the data be interpreted?
Better results in terms of interpretation and evaluation are therefore achieved by analysing a series of balance sheets and studying the trend over time of the significant balance sheet ratios, so as to understand in which management is moving the company (dynamic financial statements analysis).
How do I evaluate them?
- Temporal evolution
- Comparison with average values of the sector
- Comparison with "normal" values i.e. with the benchmark
- Comparison with objectives
Response to results
This is the last activity of the analysis cycle, where the "relay" passes into the hands of those who deal with the Management of the Company, with data that speak clearly, the Manager will have to plan how to proceed using the right Project Management techniques.
The report contain errors?
If you notice incorrect data within the report or find that for some reason the calculated amounts do not match, please follow the steps below:
- Check that the data in your accounts are correct.
- Check that you have set up the groups correctly in the settings dialog.
If the errors persist, contact us via our feedback form and send us an example accounting file (*.ac2), even with little data, but allowing us to reproduce the possible problem and correct it.
Multi-language
The extension is available in the following languages:
- English
- Italian
- French (translation currently not complete)
- German (translation currently not complete)
And will adapt according to the language in which the application is set up. For all other languages, the standard version in English will be displayed.
Save your analysis
You can save the report in the following formats:
- Html
- Excel
- Latex
Settings Dialog
Dialog is accesible:
- By going to the Extensions menu→Cash Flow Statements and financial Ratios →Financial Reports.
- By going to the Extensions menu→Cash Flow Statements and financial Ratios →Settings.
Set up the groups
The first and most important step is to enter the groups or accounts number you are using in your account table.
Once you enter the groups the report and calculations are all done automatically, except for some specific transactions for the Cash Flow Statement.
- Groups must be entered manually
- Groups must be separated by a semi-colon ';'
- Both groups and accounts can be entered
- It is important to make sure that you include elements that exist in your chart of accounts, if are entered groups or accounts that do not exist in your chart of accounts, a message will be displayed on the row of the grouping concerned, returning those elements for which a match was not found in the chart of accounts. Once corrected, you only need to run the dialogue again and the message will disappear.
- By default, the groups within the dialogue refer to the Swiss SME chart of accounts, and it is possible to return to the base scenario by clicking the Restore Defaults button. Beware, however, that in this way the customisations made will be lost, and will be replaced with the default values.
.png?raw=true)
All the necessary elements must be inserted within the different groupings defined in the dialogue (Liquidity, Fixed Asset,Owned base capital,...).
Assets
They show the total employment of a company, so the investments to which the company has allocated
the means found in carrying out its activity.
- Liquidity: Must include groups or accounts that define liquidity in the company, such as cash or bank
- Credits: Must include groups or accounts within which are recorded all the operations
concerning money due to buyers who didn’t paid yet for their purchases - Stocks: Must include groups or accounts with all goods for resale in the ordinary course of business.
- Fixed assets: Must include groups or accounts containing fixed assets elements, as:
- Buildings
- Computer equipment
- Computer software
- Furniture and fixtures
- Intangible assets
- Land
- Leasehold improvements
- Machinery
- Vehicles
Liabilities and Equity
Shows where company's resources come from. In general, the funds at the company's disposal are
classified in a way to distinguish between own funds (which flow into equity) and those from third parties.
- Short-term debt capital: Must include groups or accounts representing the company commitments that must be fulfilled, without any particular cancellation, in the current year.
- Long term debt capital: Must include groups or accounts containing that kind of capital that the company can have at its disposal for several years, on a fixed basis, and that can usually only be withdrawn within a set time limit.
- Own Base capital: Must include groups or accounts those group referring to the company's own capital.
- Reserves and Profits: Must include groups or accounts within which are recorded the amounts to be paid to reserves or designated as profits.
Revenues
Indicates what is produced by the company during a financial year. Whether it is an increase in the value of products or semi-finished products in the course of production or services in progress, revenue from the sale of products or services or the increase in the value of fixed assets thanks to own resources, all these heterogeneous factors add up.
- Sales turnover: Must include groups or accounts within which is recorded what is produced by the company during a financial year. Whether it is an increase in the value of products or semi-finished products in the course of production or services in progress.
Costs
- Costs of Merchandise and services: Must include those groups or accounts in which all costs relating to goods and services consumed during the annual financial year are recorded.
- Personnel Costs: Must include all those accounts referring to a cost due to personnel, such as:
- Salaries
- Social charges
- Severance Pay
- Pension and similar treatment
- Other costs
- Different Costs: Must include all other groups or accounts relating to costs during the operating period.
- Interests: Must include groups or accounts containing the costs of financing sources, such as bank interest payable or interest on loans.
- Depreciation and Adjustments: Must include groups or accounts where are registered possible revaluations and write-downs of equity investments, as well as of financial fixed assets and securities included in current assets that are not equity investments.
- Final Result: The group containing the difference between the costs and the revenues at the end of the year.
Average Number of employees
This information is useful for calculating efficiency ratios, enter the average number of employees in the company and find out information such as the average company revenue per employee.
Printing Preferences
To make the Analysis as close as possible to your needs you can set some preferences, and choose about the details of printing and analysis
.png?raw=true)
Printing Details
- Page header: Include the header in the report, the header is composed with the information retrieved from the properties of the file.
- Logo: Choose whether to include your company logo in the report. for information on how to set up a logo visit this Logo set up page.
- Background color of headers: Choose the colors for the table headings
- Text color of headers: Choose the color for the texts in the table headings
- Report Without colors: Check the box for no colours in the report.
Analysis Details
- Number of previous years: Set the number of previous accounts (years) to be included in the analysis, which will be added to the current year and the Budget (if present and included).If you don't know how to set the previous year to a file, go to “File→File and Accounting Properties→Options Tab.
- Number of decimals: Choose how many numbers after the decimal point you want for the digits in the report, if you don't want to have decimals you only need to insert a zero 0.
- Include Budget: If you are using the Budget table for your financial planning, you have the possibility to include it in the analysis.
- Include Budget to date column: Include the columns showing the values of the budget up to that day, compare the values with those of the year-to-date.
- Include Current year projection column: You can include the projection for the current year. The programme uses the values in the budget table to return what could be the values at the end of the year.
- Current Date: Insert the current date. If no date is entered, the date of the day is taken automatically
- Include DuPont Analysis: Choose whether to include the Dupont Analysis
- Include Control Sums: Choose whether to include the table with the control sums, useful to inform in case of errors on the totals (assets/liabilities, operating result).
- Show the formulas column: Choose whether to show the column with the calculation formulas.
- Show the acronym column: Decide whether or not to show the acronym column, which is useful for identifying the elements used for formulas.
The columns of acronyms and formulas are complementary, that's beacuse the acronym column is useful to uderstand how the formulas are composed. if you dont need these columns, just uncheck the checkbox.
Set the benchmarks
Benchmarking is a method of assessing an organisation's competences based on comparison with the "best
in class", whatever sector it belongs to. So the Benchmark is a key performance indicator on the basis of
which a company assesses its performance with regarding to products, services and business processes.
You can customise these values depending on your company:
- Sector
- Size
- Targets
These values are only representative, which means that the figures you enter are not used in the analysis but are shown as they are. In the report, they are displayed in the Benchmark column, in the indexes tables, so that you can quickly assess the situation.
.png?raw=true)
It's also possible to call the dialog from the opened report and change the parameters. The values of the
analysis will be updated automatically.
Cash Flow Statement
Cash Flow is an analytical tool that helps to visualise the positive and negative changes in liquidity as a result of management, with reference to a given period of time: it is in fact the reconstruction of monetary flows, then the difference between all the monetary income and expenditure of a company.
Cash Flow analysis is not subject to accounting rules and many investors use the data to assess the strength of the company.
Essentially, if the Cash Flow is positive, it shows the financial availability for the company within the reporting period, whereas if the cash flow is negative, it means that more resources have been absorbed than have been received.
Special Cash Flow transactions
The first step to obtain the Cash flow Statement i its to setup the account groups in the settings dialog, Most value needed for preparing the Cash Flow Statement can be calculated based on the changes of the standard account classification. Identifying Disinvestments, Revaluations, transactions and other specific movements effecting the cash flow, would require a restructuring of the account plan. We have therefore opted to identify these values, by adding a special code to the description of a transaction.
It is important that these transactions are made using the recommended account type or group, because the program searches for cashflow amounts in certain groups, so if an entry is made using another account type, there could be an error as the amount may not be found.
If we talk about entering a fixed asset account, the account must belong to one of the groups entered in the fixed assets section of the dialogue. For example, if I disinvest by selling a vehicle and I use the standard chart of accounts for SMEs, I can use the account Vehicles '1530', which is part of the group 150, which in the dialogue is entered under the section 'Tangible Assets' in the fixed assets.
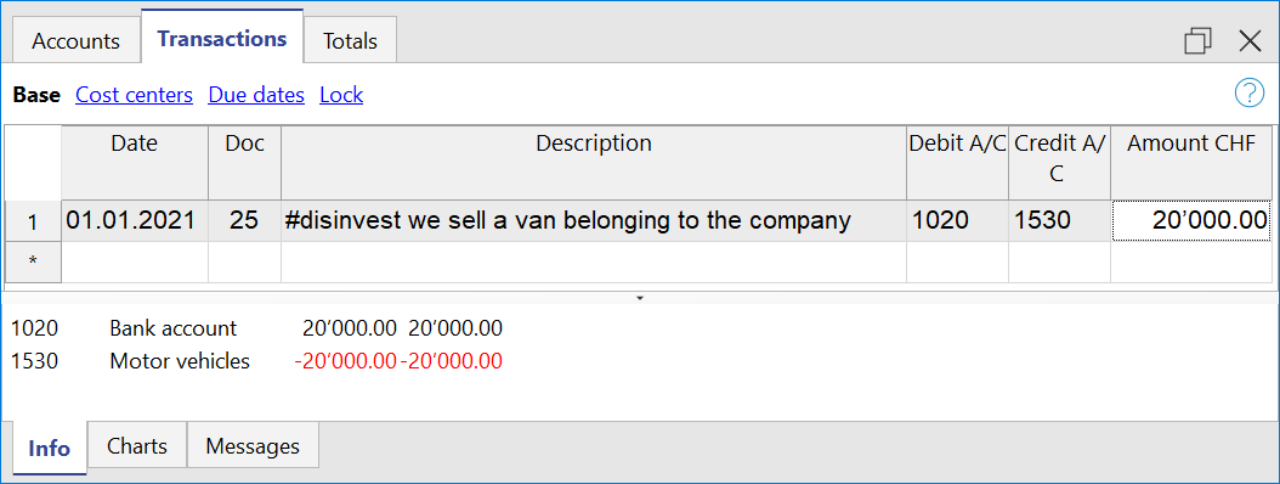
- Disinvestments (#disinvest)
- A disinvestment simply represents the sale of a fixed asset such as a vehicle or machinery. When recording a disinvestment.
- Debit Column: Insert the account where you will collect the money from the sale, such as the post or the bank.
- Credit Column: Insert a fixed asset account that relates to the item sold.
- Knowing the amount of disinvestments, the program is able to calculate in detail the real amount of investments that have been made during the year. For an SME, the number of disinvestments during the accounting period usually remains quite small, whereas investment activities are much more frequent operations, which is why it is very important to find the real amount net of all other movements.
- A disinvestment simply represents the sale of a fixed asset such as a vehicle or machinery. When recording a disinvestment.
- Revaluations of fixed assets (#revaluations)
- Revaluation of a fixed asset is the accounting process of increasing the carrying value of a company's fixed asset or group of fixed assets to account for any major changes in their fair market value.
- Debit Column: Enter the account of the fixed asset item you are revaluing to increase its value.
- Credit Colum: Enter an income account, if you don't have a particular one you can enter it as extraordinary income.
- Revaluation of a fixed asset is the accounting process of increasing the carrying value of a company's fixed asset or group of fixed assets to account for any major changes in their fair market value.
- Devaluations of fixed assets (#devaluations)
- It works in the same way as a revaluation, but instead of increasing the value of the fixed asset it decreases it, which means that the accounting entry is also reversed, i.e. the income becomes a cost.
- Debit Column: Enter a cost account, if you don't have a particular one you can enter it as extraordinary cost.
- Credit Colum: Enter the account of the fixed asset item you are revaluing to increase its value.
- It works in the same way as a revaluation, but instead of increasing the value of the fixed asset it decreases it, which means that the accounting entry is also reversed, i.e. the income becomes a cost.
- Dividends (#dividends)
- Dividends are fees paid to shareholders and usually depend on the profit made. The payment of a dividend must be recorded in a specific liability account, and should appear under short-term liabilities.
- Debit Column: Enter the reported balance sheet Profit / Loss carried forward account.
- Credit Colum: Enter the specific account for dividends.
- Dividends are fees paid to shareholders and usually depend on the profit made. The payment of a dividend must be recorded in a specific liability account, and should appear under short-term liabilities.
Cashflow Statement
Cash flow is divided into three main components:
- Operating cash flow which originates from the core business operations of a company.
- Cash flow for the company, which is the cash flow available to all investors in the company.
- Cash flow available to shareholders, which only considers the cash flows that are due to the shareholders, resulting from the net of all payments made and received, including from debt holders.
Adding up all the totals you find the amount that corresponds to the change in liquidity for the period, which in turn when added to the value of the liquidity at the opening of the period should give you the current liquidity balance.
If the results do not match, an error message is displayed.
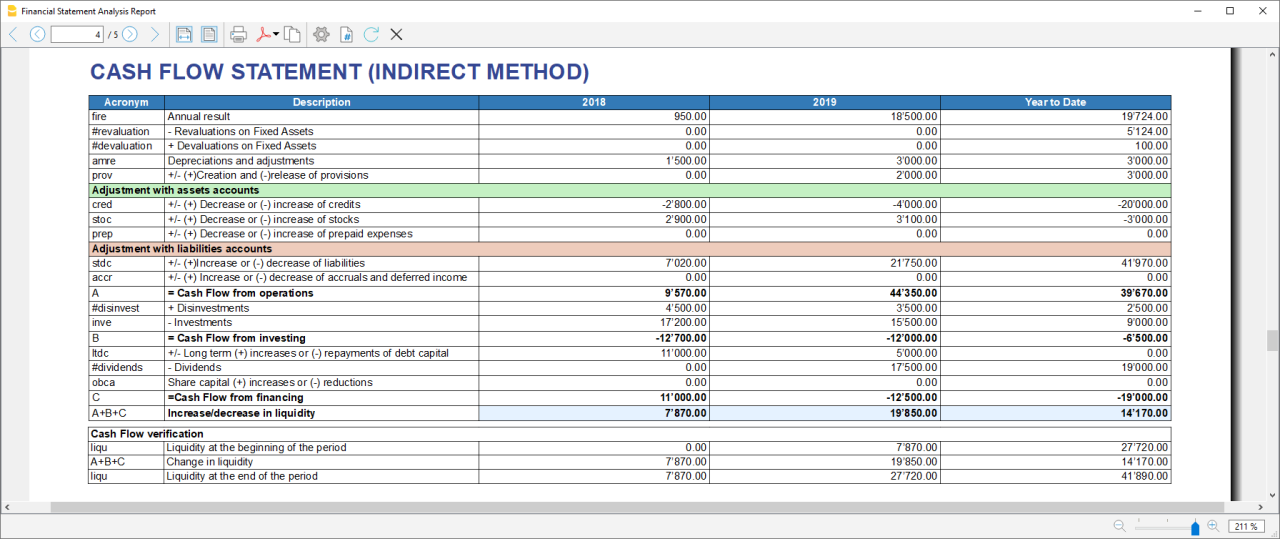
Acronym column
In the acronym column of the cashflow, the reference to the account taken into account in the calculation is entered, or in the case of special entries, the prefix of the entry, so that it is easy to see which item of the balance sheet or income statement a certain movement relates to.
Cash Flow verification
This table shows any differences between the change in cash flow calculated in the cashflow and the actual cash flow in the accounts, which in an optimal situation should match. If there is a difference in one of the years of analysis the amount in question is printed in red on a line below.
Usually, when an error occurs, the first thing to do is to check whether the amounts in the balance sheet and profit and loss statement are correct or whether there are differences between the assets and liabilities, for checking them, control sums are very useful because they immediately show whether there is a difference.
if you realise there is some error but you dont know exactly where, you can check the amounts by comparing the ones in the report with those in the chart of accounts.
The differences are generally due to an error when entering groups in the settings dialog, which can occur in two ways:
- One or more groups were not included
- One or more groups were entered under the wrong heading
In case the balance and profit and loss amounts are correct but the cashflow displays an error, is probably due to the fact that a group has been inserted in the wrong place.
Retained Earnings Statement
This table shows the movements made with the annual profit achieved. Starting from the reported annual profit it adds the profit for the period and adjusts the value by taking into account the payment of dividends and the creation or dissolution of reserves. The last two rows show the total undistributed profit, and the undistributed profit realised in the current year.

This information is somewhat supportive of Cash Flow but since earnings management does not directly affect cash, it is presented in a separate statement.
Record Transactions
It is useful to first record the transfer of the profit for the year from the profit and loss account to the profit shown in the balance sheet as shown in the example image.
In order to record the payment/discharge of reserves and the payment of dividends, it is sufficient to use the specific account of one of the above items and to decrease or increase the profit account shown in the balance sheet. The remaining amount (not allocated to reserves or dividends) then increases the retained earnings.

Cash Flow Ratios
In addition to the ratios already present, those ratios are added just below the Cashflow table and in the Charts
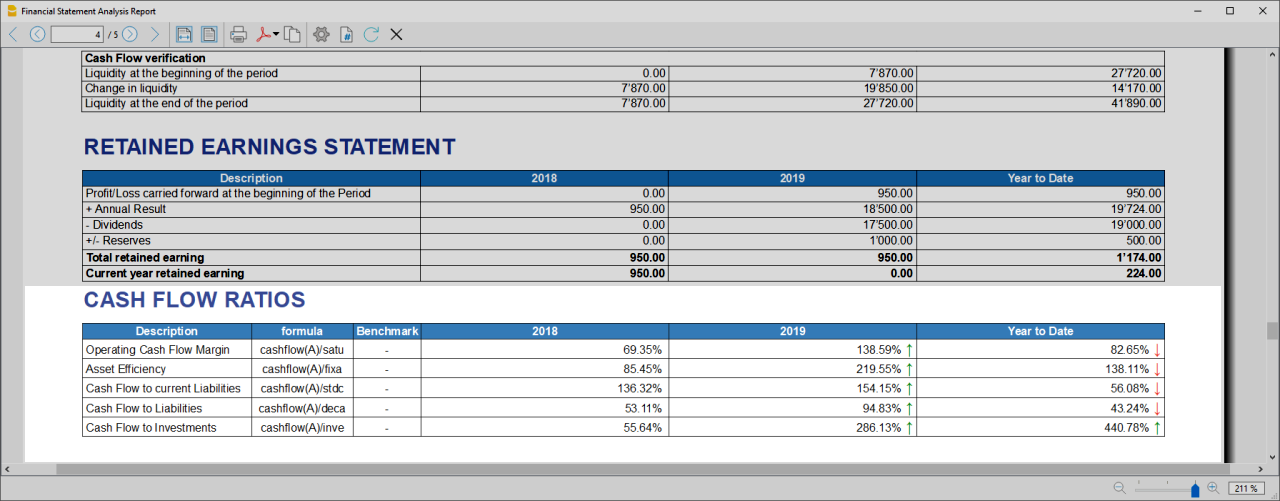
- Cashflow margin: Measures the amount of revenue a firm can convert into operating cash flow. When a firm is thriving, operating cash flow should grow alongside revenue. While profit margins measure a firm's pricing power; a declining cash flow margin also measures the health of customer and supplier relationships.
- Asset Efficiency Ratio: This is a basic ratio to show you how well the company uses its assets to generate cash flow. It’s best used to view the historical trend as well as to compare with competitors.
- Cashflow to current Liabilties: This ratio gives you an idea about the company’s debt management practices.It’s also a better indicator of the company’s ability to pay current liabilities than the current ratio or quick ratio
- Cashflow to Liabilities: Measures the amount of operating cash flow a firm generates on each dollar of total liabilities. Businesses that can't produce operating cash flow to pay off all their liabilities cannot continue to operate indefinitely, making this ratio an important indicator of liquidity as well as solvency
- Cashflow to Investments: Measures the amount a company outlays for capital assets for each dollar of cash dollar it generates from those investments.
Why Is Cash Flow Analysis Important?
Performing cash flow calculations in combination with constant monitoring of the company's cash flows is the winning formula for effective treasury management, and is useful for making the best use of available cash.
Thanks to the ability to generate cash flow and the financial solvency of the company, you gain confidence from banks and suppliers, as it symbolises a certain control over your business: the calculation of cash flow is in fact a way to detect the actual availability of the company, giving the possibility to face unexpected events or to plan consistently the future of projects.
For more information on Cashflow Analysis, please refer to the following page.
Balance Sheet and Profit and Loss Reclassification
Generate the Report by going to the Extensions menu→Cash Flow Statements and financial Ratios →Financial Reports.
The Report contains all the analysis data processed by the extension:
- Reclassified balance sheet
- Reclassified Profit and Loss Statement
- Control Sums table
Reclassified Balance Sheet
The reclassification of accounts allows for the display of a series of values, results and intermediate margins that contain more information than the traditional structure.
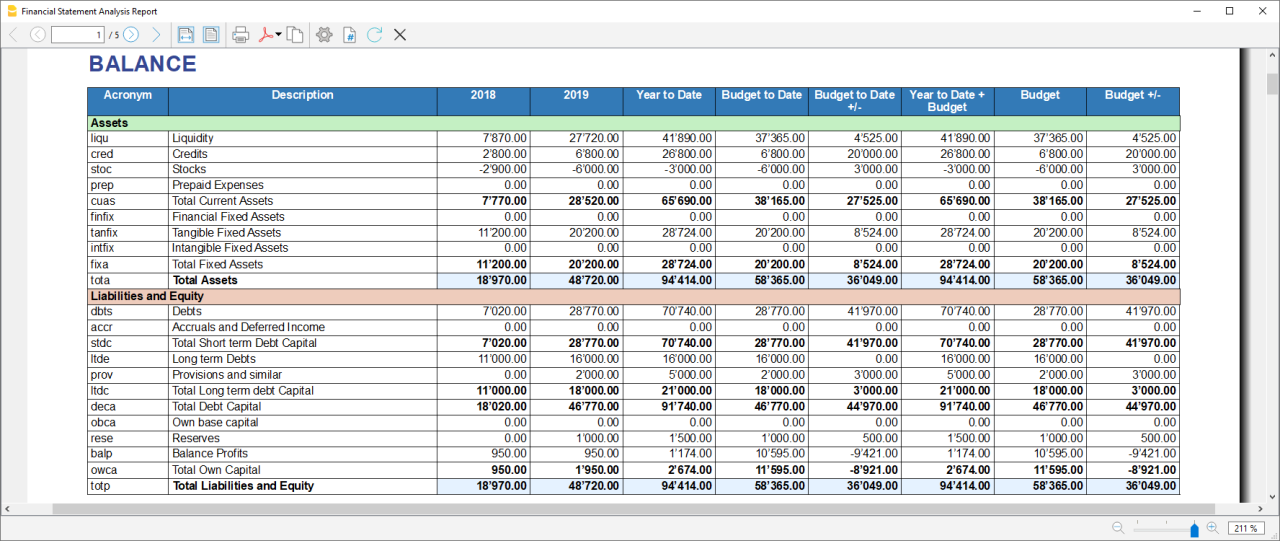
- Current Assets: All the assets of a company that are expected to be sold or used as a result of standard business operations over the next year.
- Fixed Assets: Items, such as property or equipment, a company plans to use over the long-term to help generate income.
- Total Assets: The sum of current assets and fixed assets.
- Debt Capital: Is the capital that a business raises by taking out a loan. It is a loan made to a company, typically as growth capital, and is normally repaid at some future date.
- Own Capital: It is the capital owned by the company.
- Total Liabilites and equity: The sum of Debt Capital and Own Capital.
Reclassified Profit and Loss Statement
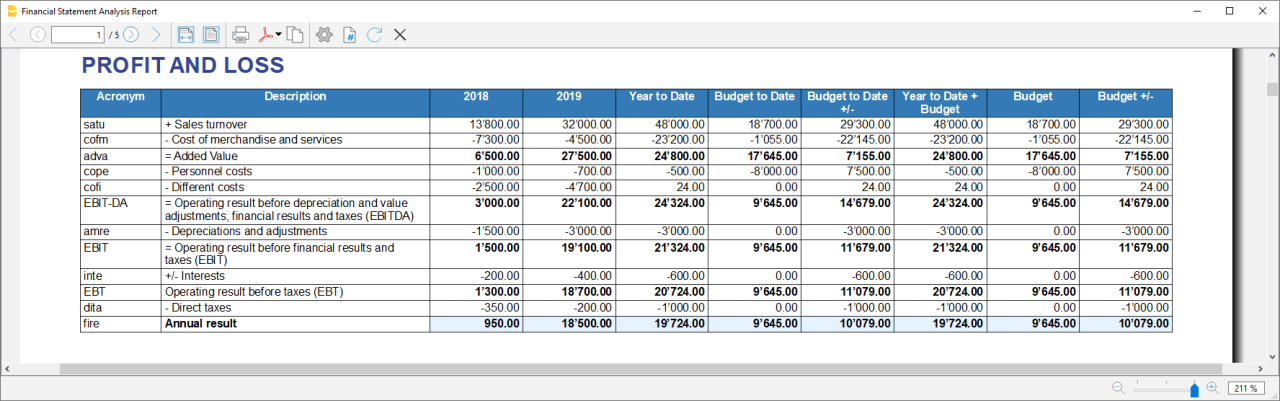
- Added value: The difference between operating costs and operating revenues incurred for resources outside the company, expresses the company's ability to create wealth and then remunerate the various production factors and stakeholders.
- MOL /EBITDA: "Earning Before Interests, Taxes, Depreciation and amortization" is obtained by subtracting from production revenues the costs of production (including internal costs such as personnel costs), without considering provisions and depreciation. As it does not contain economic items without monetary movement, its value assumes very important information for financial investors.
- EBIT :"Earning Before interests and Taxes", helps to understand whether the company is also able to cover the financial charges arising from its financial commitments.
Control Sums
Resumes the totals of the reclassified accounts (Assets, Liabilities and Equity , Annual Result). Checks that the sums calculated in the analysis match the totals in the accounting sheets and that Assets and Labilities and equity match.
- Accounting Total column: Represents the actual total in the accounts.
- Calculated Total column: Represents the total calculated by the program based on the groups entered.
- Difference column: Represents the difference found between the total in the accounts and the calculated total for each year. The value equal to 0, otherwise will be displayed an error message, which means that there may have been an error in entering the accounts/groups .In this case it is useful to check in the dialogue that you have entered the groups correctly.
Financial Ratios
Generate the Report by going to the Extensions menu→Cash Flow Statements and financial Ratios →Financial Reports.
The balance sheet ratios are formulas calculated on financial, economic and asset values. These ratios are derived from the income statement and balance sheet data. Balance sheet indices are important analysis tools that provide essential indications for the entrepreneur's activity.
It is widely used by all professionals who are interested in assessing the soundness of a company for their work.
In fact, banks use the balance sheet indexes to evaluate company loan applications.
the indexes are divided into four main types
- Liquidity ratios:
- Financing ratios
- Profitability ratios
- Efficiency ratios
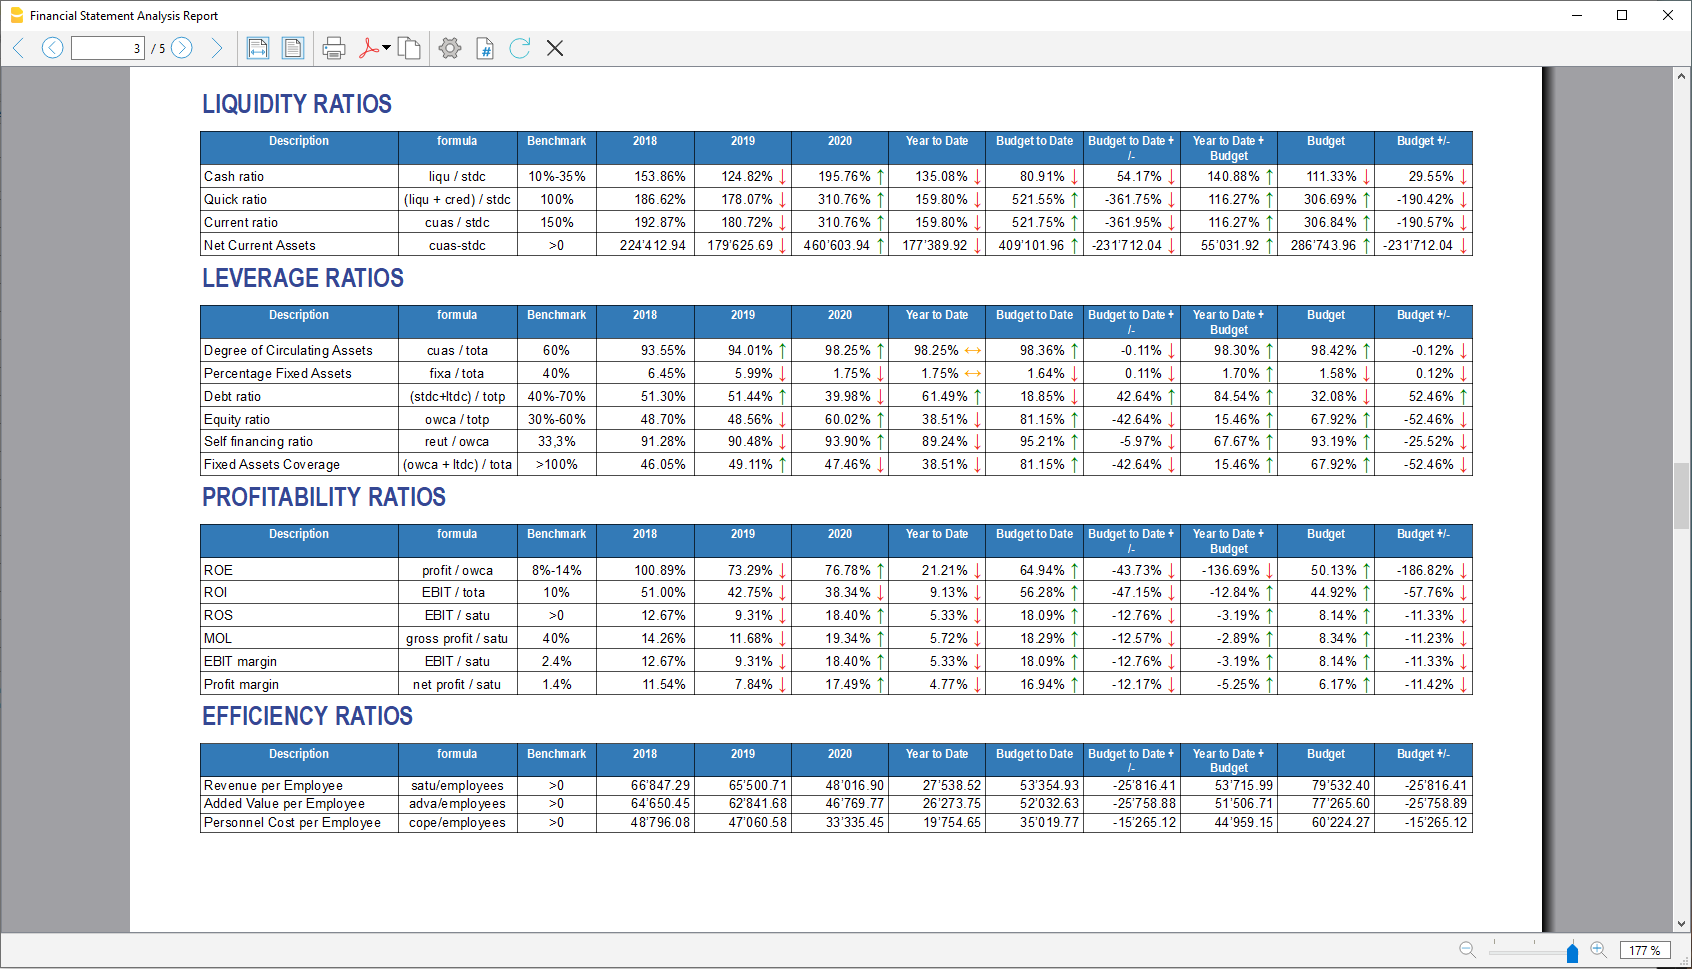
Liquidity ratios
An important class of financial metrics used to determine a debtor's ability to pay off current debt obligations without raising external capital. Liquidity ratios measure a company's ability to pay debt obligations and its margin of safety through the calculation of metrics.
- Cash ratio: Indicates the extent to which the company is able to repay its debts at the end of the term.
- Quick ratio: Indicates the extent to which the company is able to pay its debts when due.
- Current ratio: Indicates the extent to which the company is able to pay its short-term debts without touching fixed assets.
- Net Current Asset: Indicates the part of the current assets free of short-term commitments, which can therefore be used in the activity.
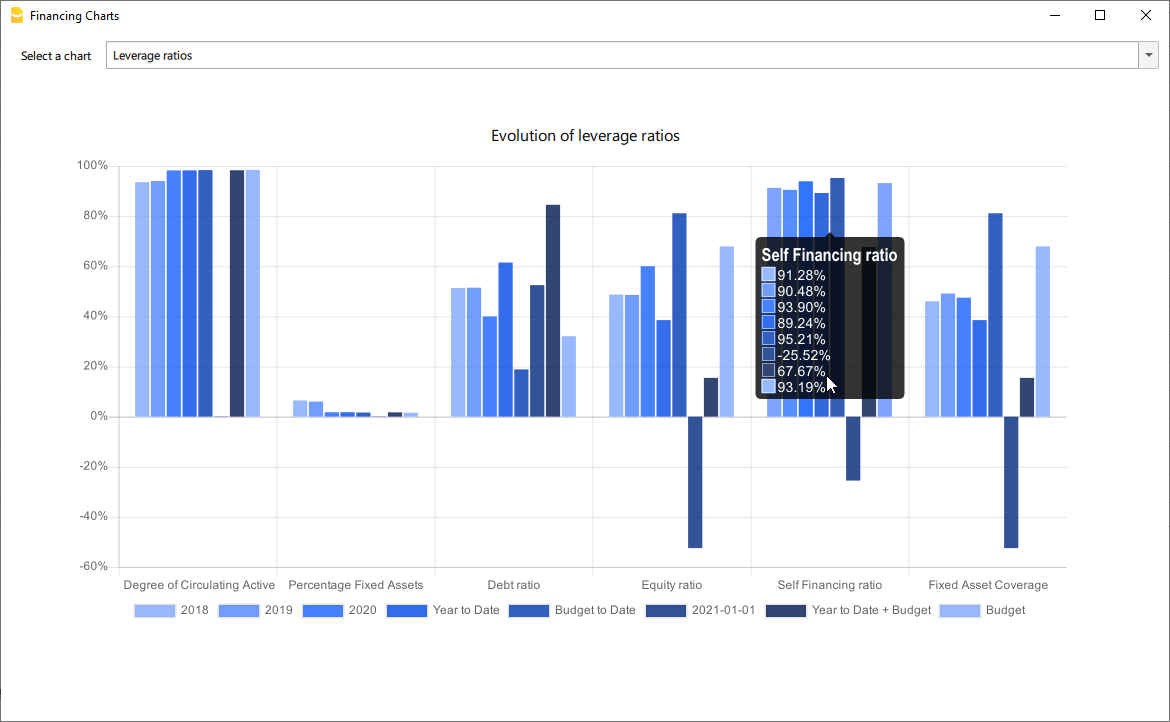
Financing ratios
They look at how much capital comes in the form of debt (loans) or assesses the ability of a company to meet its financial obligations.
- Degree of Circulating Assets: It allows us to understand whether there is a balance within the company's assets, a judgement can only be made if we have the average data for the same line of business.
- Percentage Fixed Assets: It is complementary to the previous one.
- Debt ratio: Indicates the extent to which the company has had to resort to external financing, the judgement depends very much on the branch of activity.
- Equity ratio: Is complementary to the previous one, equity ratio has the advantage of being less expensive.
- Self-Financing ratio: Indicates the extent to which the company has been able to accumulate undistributed profits.
- Fixed Asset coverage: The fixed assets must absolutely be financed from equity or possibly from long term capital, otherwise major repayment problems could occur.
Profitability ratios
Are useful to assess a business's ability to generate earnings relative to its revenue, operating costs, balance sheet assets, or shareholders' equity over time, using data from a specific point in time.
- Return on equity (ROE): By comparing the percentage obtained with the rates commonly applied for other investments, it is possible to understand whether the equity invested by the company gives a sufficient return or not.
- Return on investment (ROI): Identifies the return on invested capital. Basically it serves to understand how much the invested capital returns in terms of income.
- Gross Operating Margin (MOL) :Is a value that measures the profitability of a company. In other words, it measures the ability to make profit margins: Indicates the company's return on sales made.
- EBIT margin: Is the ratio of EBIT to turnover of a company. This ratio provides information on its profitability and helps to compare different companies and sectors.
- Profit margin: It represents what percentage of sales has turned into profits.
Efficiency ratios
Express the degree of efficiency of the company's factors of production, those chosen by us give us an indication of the relationship between the number of employees and the various margins of the profit and loss account. Efficiency indicators are related to profitability indicators, as higher productivity generates an improvement in profitability indicators.
- Revenue per Employee: An increase indicates greater efficiency of the company and a lowering of the break even point. Its increase is certainly an indicator of the good health of the company itself.
- Added Value per Employee: Gives evidence of efficiency in terms of cost reduction (e.g. economies of scale). If the revenue per capita index remains stable and the value added per capita index increases, this is evidence of cost efficiency.
- Personnel Cost per Employee: Highlights the trend in average personnel costs.
Within the tables and also visible the calculation formula of each index.
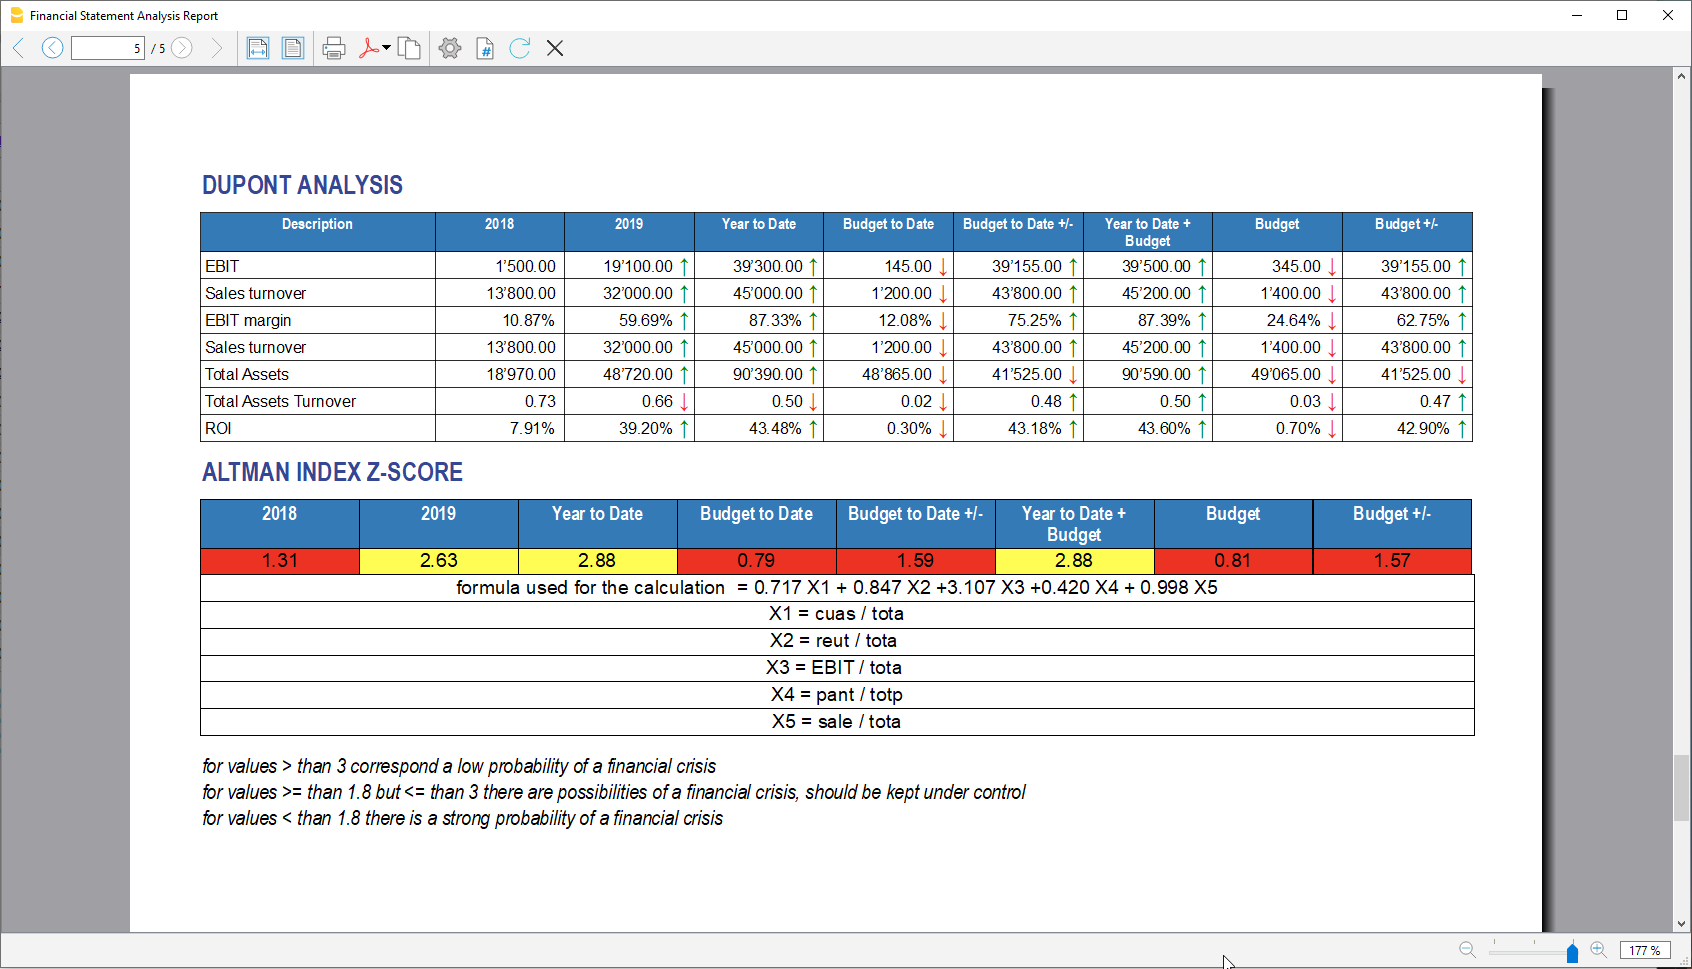
Dupont Analysis and Altman index Z-Score
Dupont Analysis
The Dupont model is a technique that can be used to analyse the profitability of a company using
traditional performance management tools. To enable this, the model integrates the elements of the Profit
and Loss Account and Balance Sheet.
Altman index Z-Score
The Z-Score is an index of the discriminating analysis used to determine the probability of bankruptcy of a
company within 2 years using statistical techniques.
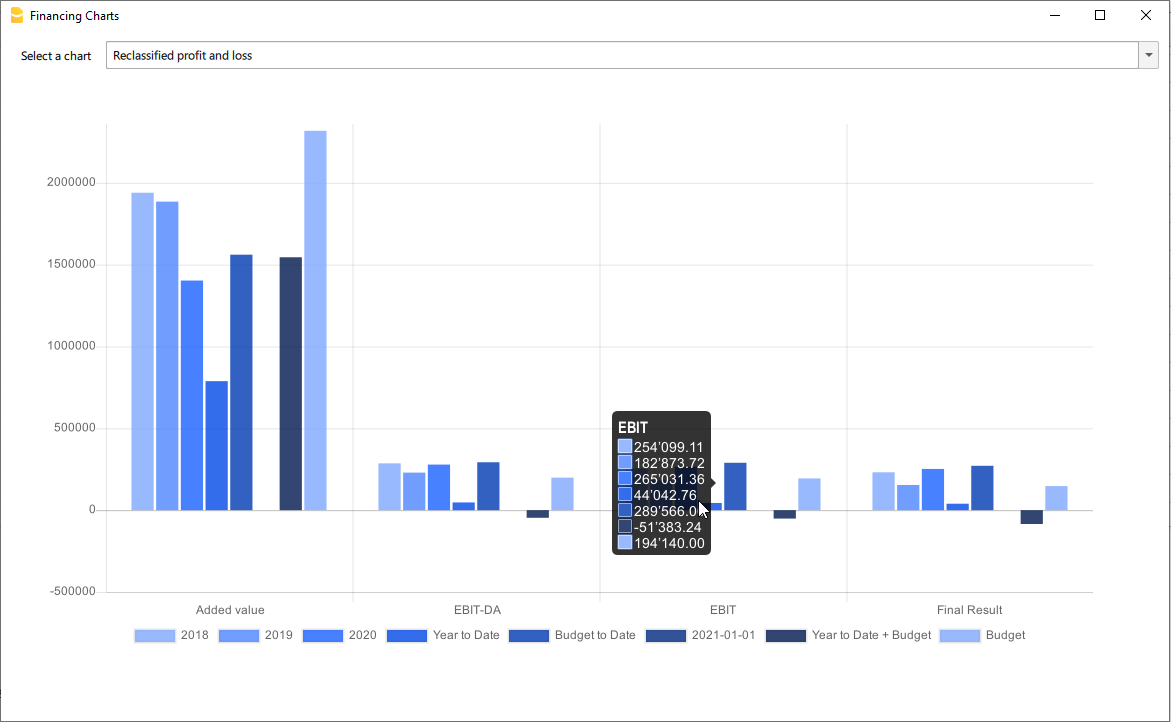
Financial Charts
It’s possible to access to the charts by going to the Extensions menu→Cash Flow Statements and financial Ratios →Financial Charts.
Charts allow you to read the same information as you can find in the report but in a clearer and more
intuitive way. Once the dialogue is open, you can move between the various elements thanks to a drop-down menu.
Ratios charts
- Financing ratios evolution
- Liquidity ratios evolution
- Profitability ratios evolution
- Efficiency ratios evolution
- Cashflow ratios evolution
These charts represent the evolution of the indexes over time. For each type of index there is a bar chart,
within which there is a section that represents the evolution over time of each index for each year included
in the analysis.
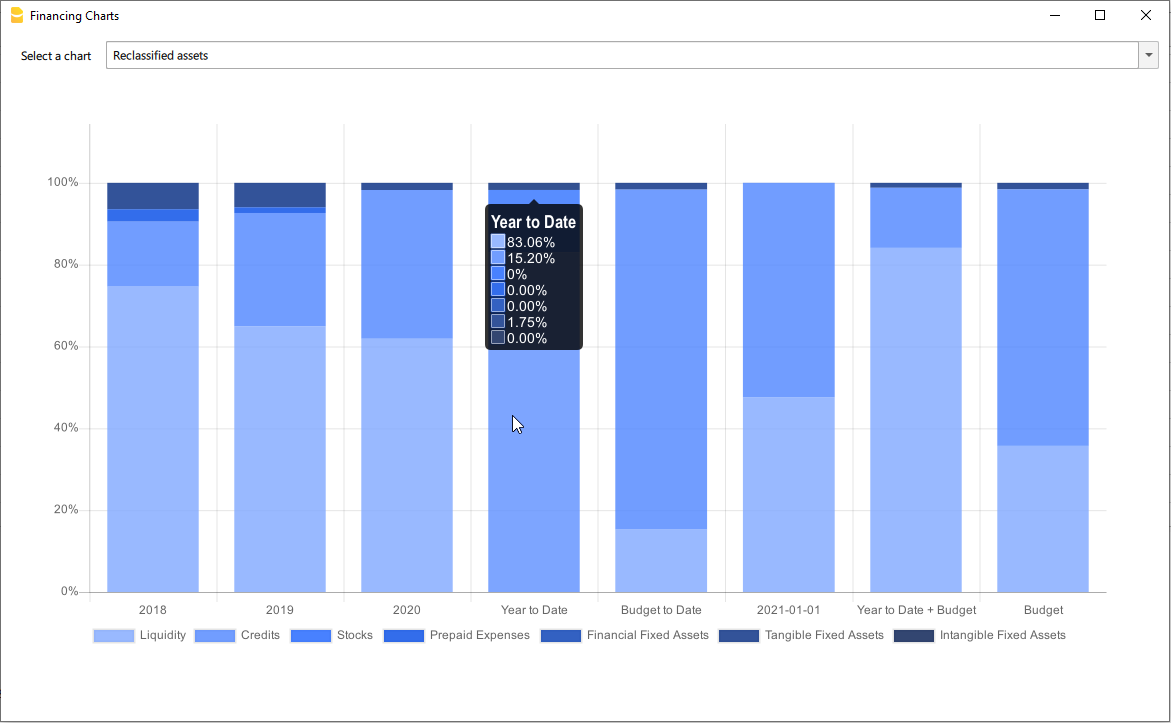
Reclassified Elements charts
- Reclassified asset variation
- Reclassified liabilities and equity variation
These charts show the time evolution of the reclassified assets, and reclassified liabilities, using stacked
chart. It is possible to see how and in what quantity the groups make up the total of assets and liabilities (in
percentage %)
Reclassified profit and loss variation
Shows by using histogram the value of the intermediate totals (EBIT,EBIT-DA,..) of the reclassified profit and loss account ,and their evolution over the time.