Ausdrucke und Berichte der Finanzprognosen
Kalkulation der Planung
Die für die Planung relevanten Daten werden unter Berücksichtigung der folgenden Punkte berechnet:
- Eröffnungssaldi der Tabelle Konten.
- Budgetbuchungen, welche in der Tabelle Budget erfasst wurden
- Vom Programm automatisch aufgrund der in den Budgetbuchungen angegebenen Wiederholungs-Einstellungen erzeugte Budgetbuchungen.
Je länger die Wiederholungsperiode ist, desto mehr Budgetbuchungen gibt es.
Berechnungs- und Datenprojektionszeitraum
Das Programm berechnet die Finanzplanung wie folgt:
- Für die kontextbezogenen Prognosedaten benutzt es den unter Menü Datei, Befehl Eigenschaften (Stammdaten) angegebenen Zeitraum.
- Für Ausdrucke und Kontoauszüge benutzt es den für den spezifischen Report angegebenen Zeitraum.
Die Prognose für den gesamten angegebenen Zeitraum wird berechnet, indem die entsprechenden Wiederholungszeilen erzeugt werden.
In Bezug auf den Zeitraum wird folgendes empfohlen:
- Als Planungszeitraum das erste Planungsjahr verwenden.
So erhält man auf Jahresbasis angegeben Wiederholungswerte, welche besser verständlich sind. - Wird eine Prognose auf mehrere Jahre gewünscht, ist der gewünschte Prognosezeitraum in der jeweiligen Perioden-Registerkarte des einzelnen Reports anzugeben.
Kontextuelle Anzeige der Budgetdaten
Die Budgetdaten werden sofort aktualisiert und gleichzeitig sichtbar gemacht.
Die Geschwindigkeit der Berechnung hängt von den folgenden Kriterien ab:
- Anzahl der Konten und Gruppen der Tabellen Konten und Kategorien
- Anzahl der in der Tabelle Budget erfassten Zeilen
- Anzahl der Budgetzeilen mit Wiederholung
- Vorhandensein von Formeln
- Eingestellter Planungszeitraum. Je länger der Zeitraum ist, desto grösser ist die Anzahl der Wiederholungsbuchungen.
Die Werte werden nach jeder Änderung neu berechnet.
Erfolgt die Berechnung langsam, kann das Visum der Option 'Totalsummen manuell nachrechnen' unter Eigenschaften (Stammdaten) (Menü Datei) durch setzen eines Visums aktiviert werden.
Um die aktualisierten Werte zu erhalten, ist somit der Befehl Totalsummen nachrechnen (Menü 'Buch1' auszuführen.
Total-Spalte der Budget-Tabelle
Die Spalte 'Total' enthält den Gesamtbudgetbetrag für die unter Menü Datei, Eigenschaften (Stammdaten) angegebene Buchhaltungsperiode (Periode zwischen 'Anfangsdatum' und 'Enddatum').
- Wenn es sich um eine einzelne Transaktion handelt, entspricht der Betrag demjenigen der Budgetbuchung.
- Wenn es sich um eine Transaktion mit Wiederholung handelt, entspricht der Betrag der Summe der Beträge aller Wiederholungen, die in die Buchhaltungsperiode fallen.
- Die Spalte 'Total' ist leer, wenn das Datum über die Buchhaltungsperiode hinausgeht.
Budget-Spalte der Konten- und Kategorientabelle
In den Tabellen Konten und Kategorien werden die aktualisierten Budgetwerte für die unter Menü Datei, Eigenschaften (Stammdaten) angegebene Buchhaltungsperiode (zwischen 'Anfangsdatum' und 'Enddatum' liegender Zeitraum) angezeigt.
- Spalte 'Budget'
Gibt die Budgetsumme des Kontos für die Abrechnungsperiode an.
Der angegebene Wert beinhaltet den Eröffnungssaldo sowie die Budgetbewegungen für die Periode. - Spalte 'Differenz Budget'
Gibt die Differenz zwischen den Spalten 'Budget' und 'Saldo' an.
Budgetdaten-Kontoauszug
Mit dem Befehl Kontoauszüge aus Menü 'Buch1' kann das Detail mit allen Budgetbewegungen erhalten werden.
- Im Dialogfenster Kontoauszüge
- In der Registerkarte 'Konten' kann zwischen den Optionen 'Effektive Buchungen' sowie 'Budget Buchungen' gewählt werden.
- In der Registerkarte 'Periode' kann die Berechnungsperiode angegeben werden. Wird ein 'Enddatum (inbegriffen)' gewählt und erfasst, welches über das Enddatum der Buchhaltung, erstellt das Programm automatisch eine Projektion der angegebenen Daten.
- Wird der Kontoauszug der Tabelle Budget bzw. der Budgetbuchungen geöffnet, wird die Tabelle mit den Budgetbewegungen angezeigt.
Finanzpläne (Buchhaltungsreports)
Bis auf wenige Ausnahmen ermöglichen alle Buchhaltungsreports die Anzeige der Budgetdaten.
- Es reicht, die Spalten 'Budget' und 'Differenz Budget' sichtbar zu machen.
Somit kann folgendes erhalten werden:
- Die Prognose-Bilanz.
- Die Prognose-Erfolgsrechnung.
- Der Liquiditätsplan.
Detail mit der Entwicklung der Saldi der einzelnen Konten oder Liquiditätsgruppen. - Der Investitionsplan.
Detail mit der Entwicklung der Saldi der einzelnen Konten oder Anlagengruppen. - Der Finanzierungsplan.
Detail mit der Entwicklung der Saldi der einzelnen Konten oder Gruppen, die Finanzierungen gruppieren. - Entwicklung der Projekte.
Detail der Kosten- und Profitstellen.
Alle für die Buchhaltung verfügbaren Personalisierungen sind auch für die Finanzplanung anwendbar:
- Die gewünschte Gruppierungsebene auswählen.
Präsentation mit Kontendetails oder nur mit Gruppen. - Auswahl der Sektionen, die eingeschlossen werden sollen.
Es kann nur die Bilanz, die Erfolgsrechnung bzw. die Kosten- und Profitstellen gedruckt werden. - Wahl der Buchhaltungsperiode.
Wird ein 'Enddatum (inbegriffen)' gewählt und erfasst, welches über das Enddatum der Buchhaltung, erstellt das Programm automatisch eine Projektion der angegebenen Daten. - Unterteilung nach Periode (monatlich, vierteljährlich, halbjährlich, jährlich).
Es werden für jede Art von Unterteilung Spalten erstellt und eine weitere für das Total der gewählten Periode.
Die Kombination der Berechnungsperiode sowie Unterteilung erlauben es, Ad-hoc-Berichte zu erstellen.- Wird als Periode 1 Jahr ohne Unterteilung angegeben, erhält man die Jahresprognose für 1 Jahr.
- Wird als Periode 1 Jahr mit vierteljährlicher Unterteilung angegeben, erhält man einen Ausdruck mit Spalten für jedes Quartal.
- Wird als Periode 6 Monate mit monatlicher Unterteilung angegeben, sieht man die detaillierte Entwicklung pro Monat.
- Wird als Periode 5 Jahre mit jährlicher Unterteilung angegeben, verfügt man über Spalten mit der Entwicklung für die 5 Jahre.
- Vergleich der aktuellen Werte mit den Budgetwerten.
- Hinzufügen von weiteren Spalten.
- Änderung des Drucklayouts.
- Speichern von Druck-Stilart.
Die Druckeinstellungen können als Komposition gespeichert und später wieder aufgerufen werden.
Es können beliebig viele Kompositionen erstellt werden.
Provisional Balance Sheet
The Balance Sheet forecast displays the Balance Sheet for a future period. It is an important tool for tracking the management of your company and allows you to verify what the company's capital structure will be like, the state of assets, of liabilities and the equity.
With Banana Accounting, thanks to the forecasting with the double entry method, you have complete forecast budgets and that you can arrange in different ways. The program also calculates forecasts over several years.
You can access a very precise vision of what the future balance sheet will look like.
The structure of the budget is the same as that used in the accounting file. When printing, you can indicate which values to display, those of the final balance, the estimate or both of those.
The forecast values are calculated taking into account the opening balances and forecast movements indicated in the Budget table. When you change a budget entry, the forecasts are instantly updated. You can simulate and test, relocate a payment, add an investment, modify sales and see how the budget changes over time.
Budget forecast values can be displayed in several ways.
Detailed forecast
The financial forecast, based on the double entry method, allows to obtain the forecasts of the balance sheet values, using the same accounts and groups as those of the accounting file. The same structure of the items that make up the financial statements is used for forecasting. Values and reports are available automatically to display in detail, day by day, how liquidity evolves, the situation of customers.
The Banana Accounting forecast presents the values for assessing the financial, equity and economic situation. The structure is customizable, it can be presented in a simple way, including the main groups and the accounts that are part of it, or in a more complex way, by inserting subgroups, for a more detailed view.
ASSETS
Current assets
- Liquidity
- Credits
- Inventory
Fixed assets
- Movable assets
- Real estate
LIABILITIES
Third party capital
- Short term debt
- Long term debt
Own capital
- Reserves
- Profit/Loss previous years
- Profit/Loss current year
Account table
In the Budget column of the Accounts table you access forecast values for all accounts and balance groups available. In a glance you have an instant overview of the budget. The values refer to the accounting period and the variations are calculated automatically with respect to the current balance.
If you need more details, you can add accounts or groups.

Enhanced Balance sheet with groups
Through Enhanced Balance Sheet with groups command, you can view the Provisional Balance Sheet, choosing the presentation mode you need.
- Indicate the values of the Budget in the columns section.
You can display the current (accounting) values, the estimate values or both. - Set up the Period.
If a period that exceeds the accounting period, is indicated, the program will automatically switch to budgeting over several years. - Indicate the subdivision by period required.
- In the Rows section, you can exclude accounts and thus have a view of groups only.
- If you think you're use this print setting again, create a Composition.
Using the different options you can customize your prints. Below are some examples.
Forecast balance sheet at the end of the current year
This print has been set up with the figures for the current year only.

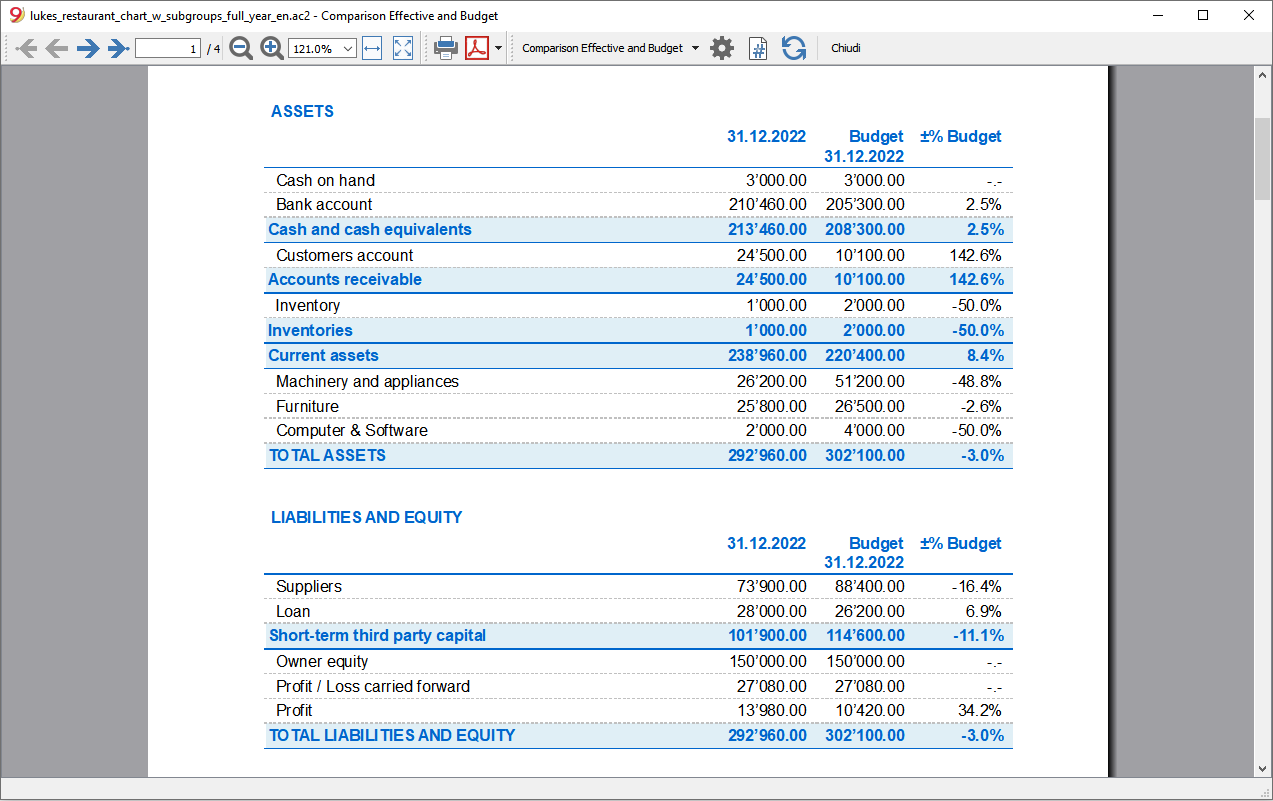
Forecast budget and comparison with the current year
The final (current) figures are compared with those of the estimate.
You can also view the variation as an amount and a percentage.
Quarterly budget
In the Subdivision section set to quarterly and the schedule shows the budget at the end of each quarter.
The evolution of the budget forecast during the year can be tracked.

Quarterly budget with comparison
This printout is set up to print both the estimate and the final balance. We therefore have the expected and current situation at the end of each quarter.

Three-year budget
This printout is set up to print the three-year budget forecast.
In the Period section set the reference period to three years and in the Subdivision section set to one year. In the File properties (File menu) there must be 3 years as the start and end period (e.g. start 01.01.2022 - end 31.12.2024).

Accounting Report
The Accounting Report is similar to the one for Enhanced balance sheet with groups, with the difference that the display takes place in the Accounts table in columns.
You can therefore use it to get an instant view of the evolution of liquidity accounts.

Provisional Profit and Loss account
The Income statement forecast presents the profits, costs and result for a future period. It is an important tool for tracking the management of the company which allows you to understand how the financial situation will evolve.
With Banana Accounting, thanks to the forecasts with the double entry method, you have complete forecast budgets and that you can organize in different ways. The program also calculates forecasts over several years.
You can have a very precise vision of the evolution of the economical situation.
The structure of the Income statement is the same as that used in accounting file. When printing, you can indicate which values to display, those of the final balance, or the budgeted balance or of both.
The forecast values are calculated taking into account the opening balances and forecast movements indicated in the Budget table. When you change a budget entry, the forecasts are instantly updated. You can simulate and test, relocate a payment, add an investment, modify sales and see how the budget changes over time.
Income statement values can be displayed in several ways.
Use of quantities and formulas
The quantity and price column of the Budget table allow you to prepare more realistic forecasts, using the same methodology as spreadsheets. This allows for faster simulations. It is sufficient that you change the price and you access the new forecasts of the income statement automatically and also those of the Balance Sheet and Liquidity.
The formulas allow you to automate cost calculation, so that for example, when you change sales the purchase costs change in percentage. In this way you can use precise income statement forecasts that update automatically. Formulas are particularly useful when making forecasts over multiple years.
Detailed forecasts
The Income statement forecast, based on the double entry method, allows you to obtain the forecasts of the costs and revenues, using the same accounts and groups as those of the accounting file. The same structure of the items, that make up the income statements, is used for forecasting. Values and reports are available automatically to display in detail, day by day, how liquidity evolves and the situation of customers.
The structure of the Chart of Accounts, on which the forecast is also based, is customizable. This can be done by simply using the main groups and the accounts that are part of it, or more in a more complex way, by also inserting subgroups, for a more detailed view.
The structure of the Profit and Loss Account is gradually scaled and allows you to view the interim and final results for the year after paying the taxes.
INCOME STATEMENT
- Revenues.
- Cost of goods.
Gross operating result (total of Revenues and Costs).
- Staff costs
- General costs.
Operating result (total of the gross operating result, personnel costs and general costs).
- Financial costs.
Operating result before taxes and depreciation(Total of operating result and financial costs).
- Depreciation.
Operating result before taxes (Total of ordinary Result and Depreciation).
- Taxes
Profit and Loss before Taxes (total of the Result before taxes and Taxes and duties).
Accounts / Category Table
In the Budget column of the Accounts table, for double entry accounting, and of the Categories table for revenue and expenditure, the forecast values for all the accounts and groups of the Income statement are displayed. With a glance you have an instant view of the forecasted Income statement. The values refer to the accounting period and the variations are compared to the current balance.
If you require more details, you can add accounts or groups.

Enhanced Balance sheet with groups
Through Enhanced Balance Sheet with groups command, you can view the Provisional Balance Sheet, choosing the presentation mode you need.
- Indicate the values of the Budget in the columns section.
You can display the current (accounting) values, the estimate values or both. - Set up the Period.
If a period that exceeds the accounting period, is indicated, the program will automatically switch to budgeting over several years. - Indicate the subdivision by period required.
- In the Rows section, you can exclude accounts and thus have a view of groups only.
- If you think you're use this print setting again, create a Composition.
Using the different options you can customize your prints. Below are some examples.
Forecast balance sheet at the end of the current year
This print has been set up with the quote values for the current year only.

Forecast income statement and current year comparison
The final (current) values are compared with those of the forecast.

Quarterly forecast income statement
In the Subdivision section set quarterly and the program shows the forecast income statement for the various quarters.
The evolution of the budget forecast during the year will now be displayed.

Quarterly budget with comparison
This printout is set up to print both the estimate and the final balance. We therefore have the expected and current situation at the end of the quarters.

Three-year forecast for Profit and Loss account
If you insert the forecast movements with the repetition code, the program is able to prepare forecasts beyond the defined period.
To obtain forecasts over several years, the transactions are entered in the Budget table with repetition (Y).
The printout is set up to obtain the estimate of the income statement over three years.

Accounting Report
The Accounting Report is similar to the one for Enhanced balance sheet with groups, with the difference that the display takes place in the Accounts table in columns.
You can therefore use it to get an instant view of the evolution of liquidity accounts.

Liquidity Planning
Cash is King is the motto that indicates how important liquidity is. It is the main engine for carrying out business activities, meeting commitments and producing profits. To invest safely, it is essential to evaluate the ability to produce liquidity and its evolution over time a rational way.
The financial forecast of Banana Accounting is an important business management tool, which allows you to understand if there will be enough financial means to meet commitments and reduce your debt exposure to the maximum.
Liquidity projections are calculated on the basis of the initial balance and forecasts included in the Budget table. When a budget movement is changed, the forecasts are instantly updated. You run simulations, assign a payment, add an investment, modify sales and see how liquidity evolves.
Liquidity values can be displayed in several ways.
Accounts table
Set up accounts and liquidity groups in the Accounts table. In the Budget column you will also see the updated forecast balances for the accounting period. At a glance you will know what the liquidity situation will be at the end of the year.

Evolution graphs
When you open the Graphs window, positioning the cursor on an account or a group you will see the graph of the evolution of Liquidity.
If you click on the Current, Previous or Estimate caption, you can hide the graph.
Account card with estimate data
Using Account card command you have the possibility to see in detail, day by day, how liquidity evolves. You can see all the movements that have an impact on liquidity.

The Account card command allows you to specify if you want to see current or budgeted movements.
- Select budget movements.
- Set the period
If you indicate a period that exceed the accounting period, the program will automatically generate Forecasts over several years. - If you indicate a group, you will see the movements of all the accounts belonging to that group.
- When you are in the Budget table, you can access the account card with a click on the icon next to the account.
Enhanced Balance sheet with groups
Through Enhanced Balance Sheet with groups you may select to work with values subdivided by column per period. In this way you can see the evolution of liquidity by day, week, month, quarter, semester, year, etc.
- In Columns section indicate that you wish to view the Budget values.
- In Sections you can select the accounts or groups you want to include in the printout.
You may select to display the asset and depreciation accounts only. - Set up the Period.
If a period that exceeds the accounting period, is indicated, the program will automatically switch to budgeting over several years. - Indicate the subdivision by period required.
- If you think you're use this print setting again, create a Composition.

Accounting Report
The Accounting Report is similar to the one for Enhanced balance sheet with groups, with the difference that the display takes place in the Accounts table in columns.
You can therefore use it to get an instant view of the evolution of liquidity accounts.

Forecasting sales
Sales for a company are the main source of income and liquidity. Unlike costs that are more easily planned, sales are more difficult to budget. As a rule of thumb, you may base yourself on the figure of the sales of the previous year for the same period or, on the possibility important events that are in the pipeline and could lead to an increase in sales or even to the acquisition of new customers.
Based on this concept, Banana accounting, with the forecast based on double-entry accounting, allows you to simulate and project different scenarios over time. Just change the budgeted amounts for sales and the program automatically updates the forecasts and displays detailed reports for the current year or for future years.
The sales projections are calculated on the basis of the forecasts included in the Budget table and can be displayed in different ways.
Accounts table
Set up accounts and sales groups in the Accounts table. In the Budget column you will also have the updated forecast balances for the accounting period. You can check what the evolution of sales will be during the year, at a glance

Evolution chart for sales
If you display the Graphs window, position the cursor on an account or a group and you will see the graph of the evolution of the sales.
If you click on the Current, Previous or Budget caption, you can hide the graph.
Account card with Budget data
With the Account card you are offered the possibility to display in detail and day by day, how sales evolve. You can examine all the movements that impact sales.

The Account card command allows you to specify if you want to display current or budgeted movements.
- Select thebudget movements.
- Set the period.
If you indicate a period that extends beyond the accounting period, the program will automatically generate Forecasts over several years. - If you indicate a group, you will see the movements of all the accounts belonging to that group.
- When you are in the Budget table, you can access the account card with a click on the icon next to the account.
Enhanced Balance sheet with groups
Through Enhanced Balance Sheet with groups you may select to work with values subdivided by column per period. In this way you can see the evolution of liquidity by day, week, month, quarter, semester, year, etc.
- In Columns section indicate that you wish to view the Budget values.
- In Sections you can select the accounts or groups you want to include in the printout.
You may select to display the asset and depreciation accounts only. - Set up the Period.
If a period that exceeds the accounting period, is indicated, the program will automatically switch to budgeting over several years. - Indicate the subdivision by period required.
- If you think you're use this print setting again, create a Composition.

Financial forecasting for customers
Customers forecasting completes financial planning with customer data. For example, a company can forecast sales by indicating accounts for the most important customers.
Forecasting with the double entry method also allows you to indicate accounts for individual clients. Depending on the requirement, customer management can be done with balance sheet accounts, profit and loss accounts or with cost and profit centers.
When changing a budget movement, the forecasts for each customer are also updated individually.
Accounts table
Set up accounts for customers in the Accounts table. In the Estimate column you will also have the updated forecast balances for the accounting period. At a glance, you can view what the forecast for the individual customer will be.

Evolution chart
If you display the Graphs window, positioning the cursor on an account or a group you will see the graph for the evolution of the customers.
If you click on the Current, Previous or Estimate caption, you can hide the graph.
Account card with estimate data
With the Account card command you have the possibility to see in detail all the movements for each customer.

- Select budget movements.
- Indicates the customer's account.
- Set up the period.
If you indicate a period that extends beyond the accounting period, the program will automatically generate Forecasts over several years. - When indicating a group, you will see the movements of all the accounts belonging to that group.
- When in the Budget table, you can access the customer's card with a click on the small icon next to the account number.
Enhanced Balance sheet with groups
Through Enhanced Balance Sheet with groups you may select to work with values subdivided by column per period. In this way you can see the evolution of liquidity by day, week, month, quarter, semester, year, etc.
- In Columns section indicate that you wish to view the Budget values.
- In Sections you can select the accounts or groups you want to include in the printout.
You may select to display the asset and depreciation accounts only. - Set up the Period.
If a period that exceeds the accounting period, is indicated, the program will automatically switch to budgeting over several years. - Indicate the subdivision by period required.
- If you think you're use this print setting again, create a Composition.
Accounting Report
The Accounting Report is similar to the one for Enhanced balance sheet with groups, with the difference that the display takes place in the Accounts table in columns.
You can therefore use it to get an instant view of the evolution of liquidity accounts.

Financial forecasting for suppliers
Supplier forecasting completes financial planning with supplier data. For exa, a company can plan purchases by indicating purchases by indicating accounts for the most important suppliers. It will thus be able to analyze and optimize the relationship with the various suppliers, perhaps by requesting payment extensions.
Forecasting with the double entry method also allows you to indicate accounts for individual suppliers. Depending on the need, suppliers management can be done with balance sheet accounts, profit and accounts or with cost and profit centers.
When changing a budget movement, the forecasts for each individual supplier are also updated.
Accounts table
Set up accounts for suppliers in the Accounts table. In the Estimate column you will also have the updated forecast balances for the accounting period. At a glance you can know what the forecast for the individual supplier will be.

Evolution chart
If you view the Graphs window, positioning the cursor on an account or a group you will see the graph for the evolution of the suppliers.
If you click on the Current, Previous or Estimate legend, you can hide the graph.
Account card with estimate data
With the Account card command you have the possibility to see in detail all the movements for each supplier.

- Select budget movements.
- Indicates the supplier’s account.
- Set up the period.
If you indicate a period that extends beyond the accounting period, the program will automatically generate Forecasts over several years. - When indicating a group, you will see the movements of all the accounts belonging to that group.
- When in the Budget table, you can access the customer's card with a click on the small icon next to the account number.
Enhanced Balance sheet with groups
Through Enhanced Balance Sheet with groups you may select to work with values subdivided by column per period. In this way you can see the evolution of liquidity by day, week, month, quarter, semester, year, etc.
- In Columns section indicate that you wish to view the Budget values.
- In Sections you can select the accounts or groups you want to include in the printout.
You may select to display the asset and depreciation accounts only. - Set up the Period.
If a period that exceeds the accounting period, is indicated, the program will automatically switch to budgeting over several years. - Indicate the subdivision by period required.
- If you think you're use this print setting again, create a Composition.
Accounting Report
The Accounting Report is similar to the one for Enhanced balance sheet with groups, with the difference that the display takes place in the Accounts table in columns.
You can therefore use it to get an instant view of the evolution of liquidity accounts.

Investments Planning
The investment plan presents the expected evolution of the equipment, stocks, movable or immovable values that are necessary for the company.
With Banana Accounting, thanks to the forecasting with the double-entry method, you can track what the evolution of assets will be over time. You generate comprehensive forecasts, which you can organize in different ways. The program also calculates forecasts over several years.
The structure of the accounts is identical to the one used for accounting. When printing, you can indicate whether to select which values to display, the final ones only, the forecasted ones or both together.
You also have the Income statement forecasts, so you can display the evolution of amortization and interest. When a budget movement is changed, the forecasts are immediately updated. You can run simulations, assign a payment, add an investment, change sales and see how asset accounts evolve.
For the Investment Plan, you have the same options as in the Liquidity Planing and the Provisional Profit and Loss Account.
Using formulas
The formulas allow you to automate calculation of depreciation and interest. When you increase an investment, the Income statement will also be instantly be updated. Formulas are particularly useful when making forecasts over multiple years.
Chart of Accounts
In the Budget column of the Chart of Accounts the forecast values for all accounts and balance groups are displayed, and therefore, for all those relating to investments equally. With a glance, you have an instant view of the values referring to the accounting period.

If you require more investment details, you may add accounts or groups.
Evolution graphs
If you view the Graphs window, positioning the cursor on an account or a group you will have the graph of the evolution of the investments.
If you click on the Current, Previous or Estimate caption, you can hide the graph.
Account card with estimate data
Using the Account card command, will offer you the possibility to see in detail, day by day, the evolution for each asset and the depreciation accounts. You can check all the movements that have an impact on investments.
The Account card command allows you to specify if you want to see current or budgeted movements.

- Select budget movements.
- Set the period
If you indicate a period that exceeds the accounting period, the program will automatically generate Forecasts over several years. - If you indicate a group, you will see the movements of all the accounts belonging to that group.
- When you are in the Budget table, you can access the account card with a click on the small icon next to the account.
Enhanced Balance sheet with groups
Through Enhanced Balance Sheet with groups you may select to work with values subdivided by column per period. In this way you can see the evolution of liquidity by day, week, month, quarter, semester, year, etc.
- In Columns section indicate that you wish to view the Budget values.
- In Sections you can select the accounts or groups you want to include in the printout.
You may select to display the asset and depreciation accounts only. - Set up the Period.
If a period that exceeds the accounting period, is indicated, the program will automatically switch to budgeting over several years. - Indicate the subdivision by period required.
- If you think you're use this print setting again, create a Composition.

Accounting Report
The Accounting Report is similar to the one for Enhanced balance sheet with groups, with the difference that the display takes place in the Accounts table in columns.
You can therefore use it to get an instant view of the evolution of liquidity accounts.

Corporate financing plan
The corporate financing plan presents the expected evolution of the accounts relative to the origin of third party and own capital.
With Banana Accounting, thanks to the forecasting with the double-entry method, you can track what the evolution of assets will be over time. You generate comprehensive forecasts, which you can organize in different ways. The program also calculates forecasts over several years.
The structure of the accounts is identical to the one used for accounting. When printing, you can indicate whether to select which values to display, the final ones only, the forecasted ones or both together.
Income statement forecasts are also available, so you can display the evolution of depreciation and interest. When a budget movement is changed, the forecasts are immediately updated. You can run simulations, assign a payment, add an investment, change sales and see how asset accounts evolve.
For the Investment Plan, you have the same options as for the Liquidity Planing and the Provisional Profit and Loss Account.
Using formulas
The formulas allow you to automate calculation of depreciation and interest. When you increase an investment, the income statement will also be instantly be updated. Formulas are particularly useful when making forecasts over multiple years.
Chart of Accounts
In the Budget column of the Chart of Accounts the forecast values for all accounts and balance groups are displayed, and therefore, also for all those relating to investments. With a glance you get an instant view of the values referring to the accounting period.

If you require more investment details, you may add accounts or groups.
Evolution graphs
If you view the Graphs window, positioning the cursor on an account or a group you will see the graph of the evolution of the corporate finances
If you click on the Current, Previous or Estimate caption, you can hide the graph.
Account card with estimate data
Using Account card command you have the opportunity to see in detail, day by day, The evolution for each asset and on the depreciation accounts. You can see all the movements that have an impact on investments.
The Account card command allows you to specify if you want to see current or budgeted movements.

- Select budget movements.
- Set the period
If you indicate a period that exceed the accounting period, the program will automatically generate Forecasts over several years. - If you indicate a group, you will see the movements of all the accounts belonging to that group.
- When you are in the Budget table, you can access the account card with a click on the icon next to the account.
Enhanced Balance sheet with groups
Through Enhanced Balance Sheet with groups you may select to work with values subdivided by column per period. In this way you can see the evolution of liquidity by day, week, month, quarter, semester, year, etc.
- In Columns section indicate that you wish to view the Budget values.
- In Sections you can select the accounts or groups you want to include in the printout.
You may select to display the asset and depreciation accounts only. - Set up the Period.
If a period that exceeds the accounting period, is indicated, the program will automatically switch to budgeting over several years. - Indicate the subdivision by period required.
- If you think you're use this print setting again, create a Composition.
Accounting Report
The Accounting Report is similar to the one for Enhanced balance sheet with groups, with the difference that the display takes place in the Accounts table in columns.
You can therefore use it to get an instant view of the evolution of liquidity accounts.

Project planning with profit and cost centres
Financial planning of projects allows you to take control over the income and expenses of a project. It is used to evaluate investments and returns on a project and to track its implementation.
Budgeting with the double-entry method allows you to indicate profit and cost centres as well. You only need to set up cost centers for the different projects, and in parallel to the balance and income statement forecasts, you will have the forecasts available for each individual project.
The projections are calculated on the basis of the initial balance and the forecasts entered in the Budget table. When a line is changed the budget, forecasts are instantly updated. You can produce simulations, reassign a payment, add an investment, modify sales and spot how the budget changes.
Values of liquidity can be displayed in several ways.
Chart of Accounts
Profit and Cost centres are set up in the Chart of Accounts. In the Estimate column you will also have the updated forecast balances for the accounting period. At a glance you can know what the liquidity situation will be at the end of the year.

Evolution chart
In the Graphs view window, position the cursor on an account or a group and a graph of the evolution of the projects will be displayed.
Clicking on the Current, Previous or Estimate legend, you can hide the graph.
Account card with budget data
With the Account card command you have the possibility to display all the movements for the single project in detail.

- Select budget movements.
- Indicate the cost or profit center.
- Set the period.
If you indicate a period that extends beyond the accounting period, the program will automatically switch to Forecasts over several years. - When you indicate a group, you will see the movements of all the accounts belonging to that group.
- When in the Budget table, you can access the cost center tab by clicking on the small icon next to the account number.
Enhanced Balance sheet with groups
With the Enhanced Balance sheet with groups you choose to divide the values into separate columns for each segment. Thus, you dispose of a view of the evolution of individual projects by day, week, month, trimester, semester, year etc..
- Indicate that you wish to display the Budget values in the Columns section.
- In Sections you may choose to view the the cost and profit centres only.
- Set up the Period.
If you indicate a period that extends beyond the accounting period, the program will automatically switch to Forecasts over several years. - Indicate the required subdivision by segments.
- If you think of continuing to use this print setting, create a composition.

Accounting report
The Accounting report is similar to the Enhanced balance sheet with groups, with the difference, that the display takes place in columns.
It can therefore be used to display an instant view of the evolution of the segments.

Planning with segments per sector and branch
The financial planning by sectors allows you to run budget and income statement forecasts for each sector or branch of the company. It therefore allows you to evaluate the various sectors of the company and understand what contribution each of them brings to the overall activity.
Budgeting with the double-entry method permits you to designate segments as well. When you set the segments for the different sectors, use them when you enter the budget movements and the budget and income statement forecasts will be made available, divided by the different sectors.
The projections are calculated on the basis of the initial balance and the forecasts entered in the Budget table. When a line in the budget is changed , forecasts are instantly updated. You can produce simulations, reassign a payment, add an investment, modify sales and spot how the budget changes.
Values of liquidity can be displayed in several ways.
Chart of Accounts
Segments are set up in the Chart of Accounts. When indicating the segments for the Balance Sheet and Income statement accounts, the balance of the segment will always result as zero in the accounts.

Account card with budget data
With the Account/Category cards command you have the possibility to examine all the movements for each segment in detail.
- Select budget movements
- Indicate the required segment.
- Set the period.
If you indicate a period that extends beyond the accounting period, the program will automatically switch to Forecasts over several years. - If you indicate a group, you will see the movements of all the segments belonging to that group.
- When you are logged in the Budget table, you can access the cost center tab with a click on the small icon next to the account number.

Enhanced Balance sheet with groups
With the Enhanced Balance sheet with groups you choose to divide the values into separate columns for each segment. Thus, you dispose of the Balance Sheet and Income statement for each sector.
- Indicate that you wish to display the Budget values in the Columns section.
- In Sections you may choose to view the balance sheet or income statement only.
- Set up the Period.
If you indicate a period that extends beyond the accounting period, the program will automatically switch to Forecasts over several years. - Indicate the required subdivision by segments.
- If you think of continuing to use this print setting, create a composition.

Accounting report
The Accounting report is similar to the Enhanced balance sheet with groups, with the difference that, the display takes place in columns.
It can therefore be used to display an instant view of the evolution of the segments.
